🐻 CCL: $1.8M Bearish Put Bet Targets $30 Strike - Whale Hedging Into Q1 Earnings!
📅 February 9, 2026 | 🔥 Unusual Activity Detected
🎯 The Quick Take
Someone just dropped $1.8 MILLION on CCL puts betting the stock falls to $30 by July! With the stock trading near 52-week highs around $33 and Q1 earnings coming March 20, this whale is either hedging a massive long position or sees storm clouds ahead for the cruise giant. Either way, when big money pays nearly $2M for downside protection, we pay attention! 👀
🏢 Company Overview
Carnival Corporation (CCL) is the largest global cruise company, operating more than 90 ships across multiple brands including Carnival Cruise Lines, Holland America, Princess Cruises, and Seabourn in North America, plus P&O Cruises, Cunard, Aida, and Costa Cruises internationally.
| Metric | Value |
|---|---|
| Market Cap | $46.98B |
| Industry | Water Transportation - Cruise Lines |
| Employees | 117,000 |
| 52-Week Range | $15.07 - $34.03 |
| Current Price | $33.04 |
The company welcomed approximately 14 million guests in 2025 and recently reported record full-year adjusted net income of $3.1B. They've reinstated dividends for the first time since COVID and are pursuing a dual-listing unification expected in Q2 2026.
💰 The Option Flow Breakdown
📊 What Just Happened
| Date | Time | Buy/Sell | Call/Put | Expiration | Strike | Volume | OI | Size | Premium | Spot | Option Symbol |
|---|---|---|---|---|---|---|---|---|---|---|---|
| 2026-02-09 | 12:43:44 | BUY | PUT | 2026-07-17 | $30 | 9,700 | 135 | 7,700 | $1.8M | $33.13 | CCL20260717P30 |
🤓 What This Actually Means
Let me break this down for you:
📊 Trade Classification: Long Put (Standalone)
🐋 Volume vs Open Interest: The volume of 9,700 contracts absolutely dwarfs the existing open interest of just 135 contracts. We're talking about a Vol/OI ratio of 71.85x - that's HIGH_ACTIVITY territory!
💰 Premium Breakdown: At $2.40 per contract for 7,700 contracts, someone paid $1.8M for the right to sell CCL at $30. That's a 9.5% out-of-the-money put with 158 days until expiration.
🤔 Why This Matters: This is either:
- Institutional Hedging - A fund with a massive CCL long position protecting against downside into Q1 earnings
- Directional Bear Bet - Someone believes CCL revisits $30 by July
- Pre-Earnings Protection - March 20 earnings + April 17 shareholder vote create binary risk
The 5-month timeframe suggests this isn't a short-term gamble - they're playing the earnings cycle AND the summer seasonality.
📈 Technical Setup / Chart Check-Up
YTD Performance
CCL has been on a tear, recently hitting fresh 52-week highs near $34.03. The stock has gained +10.48% over the past 3 months and +8.4% over the trailing 12 months. According to The Markets Daily, CCL hit a new 1-year high on February 5, 2026.
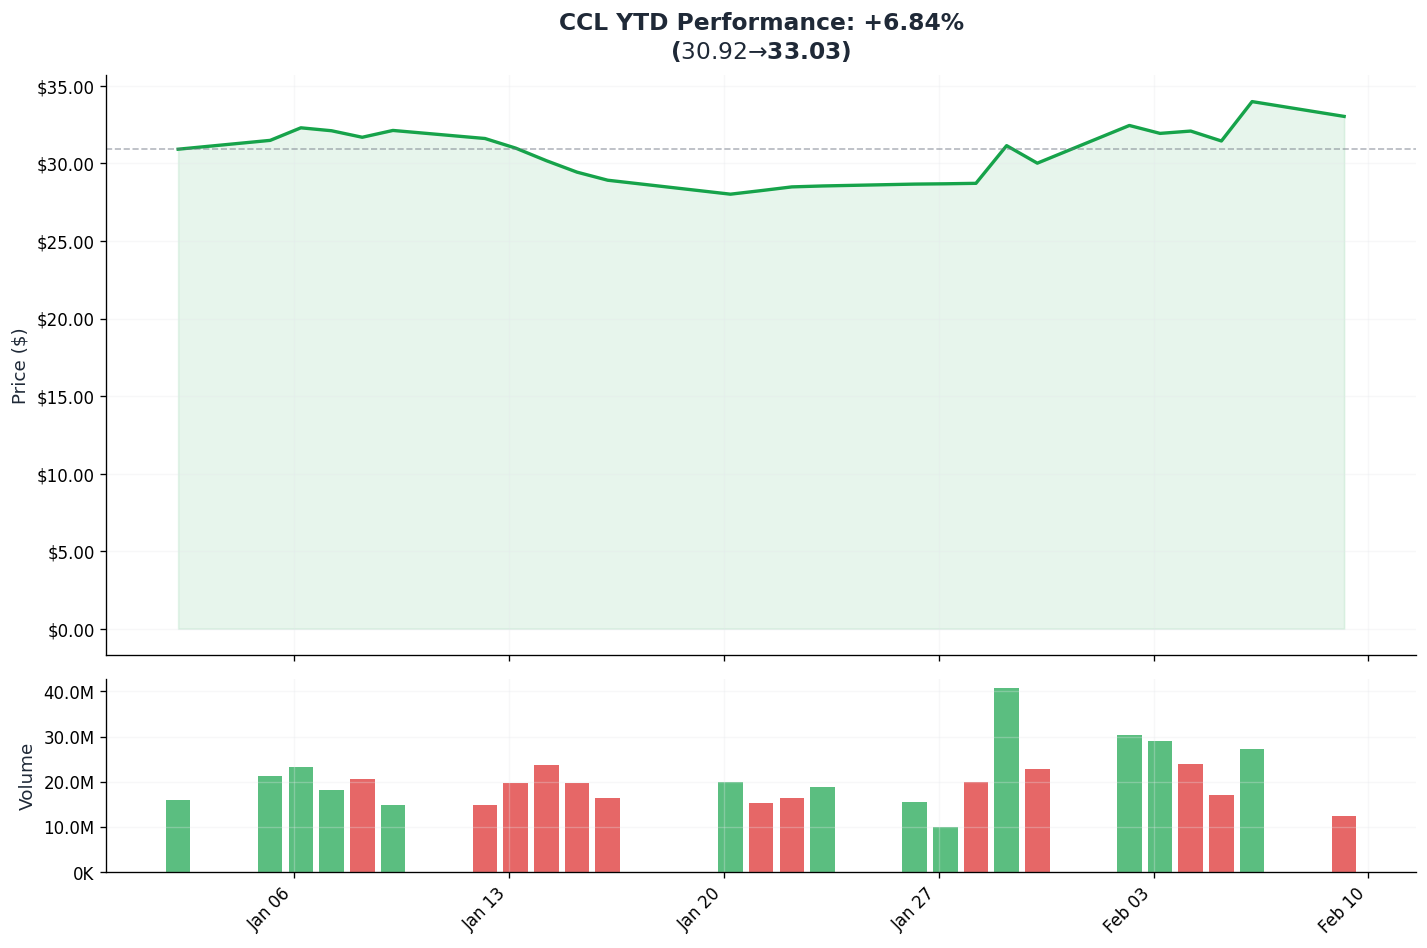
The stock is trading near the upper end of its range, which makes this bearish put purchase even more interesting. Whale traders often hedge at tops!
🔵🟠 Gamma-Based Support & Resistance Analysis
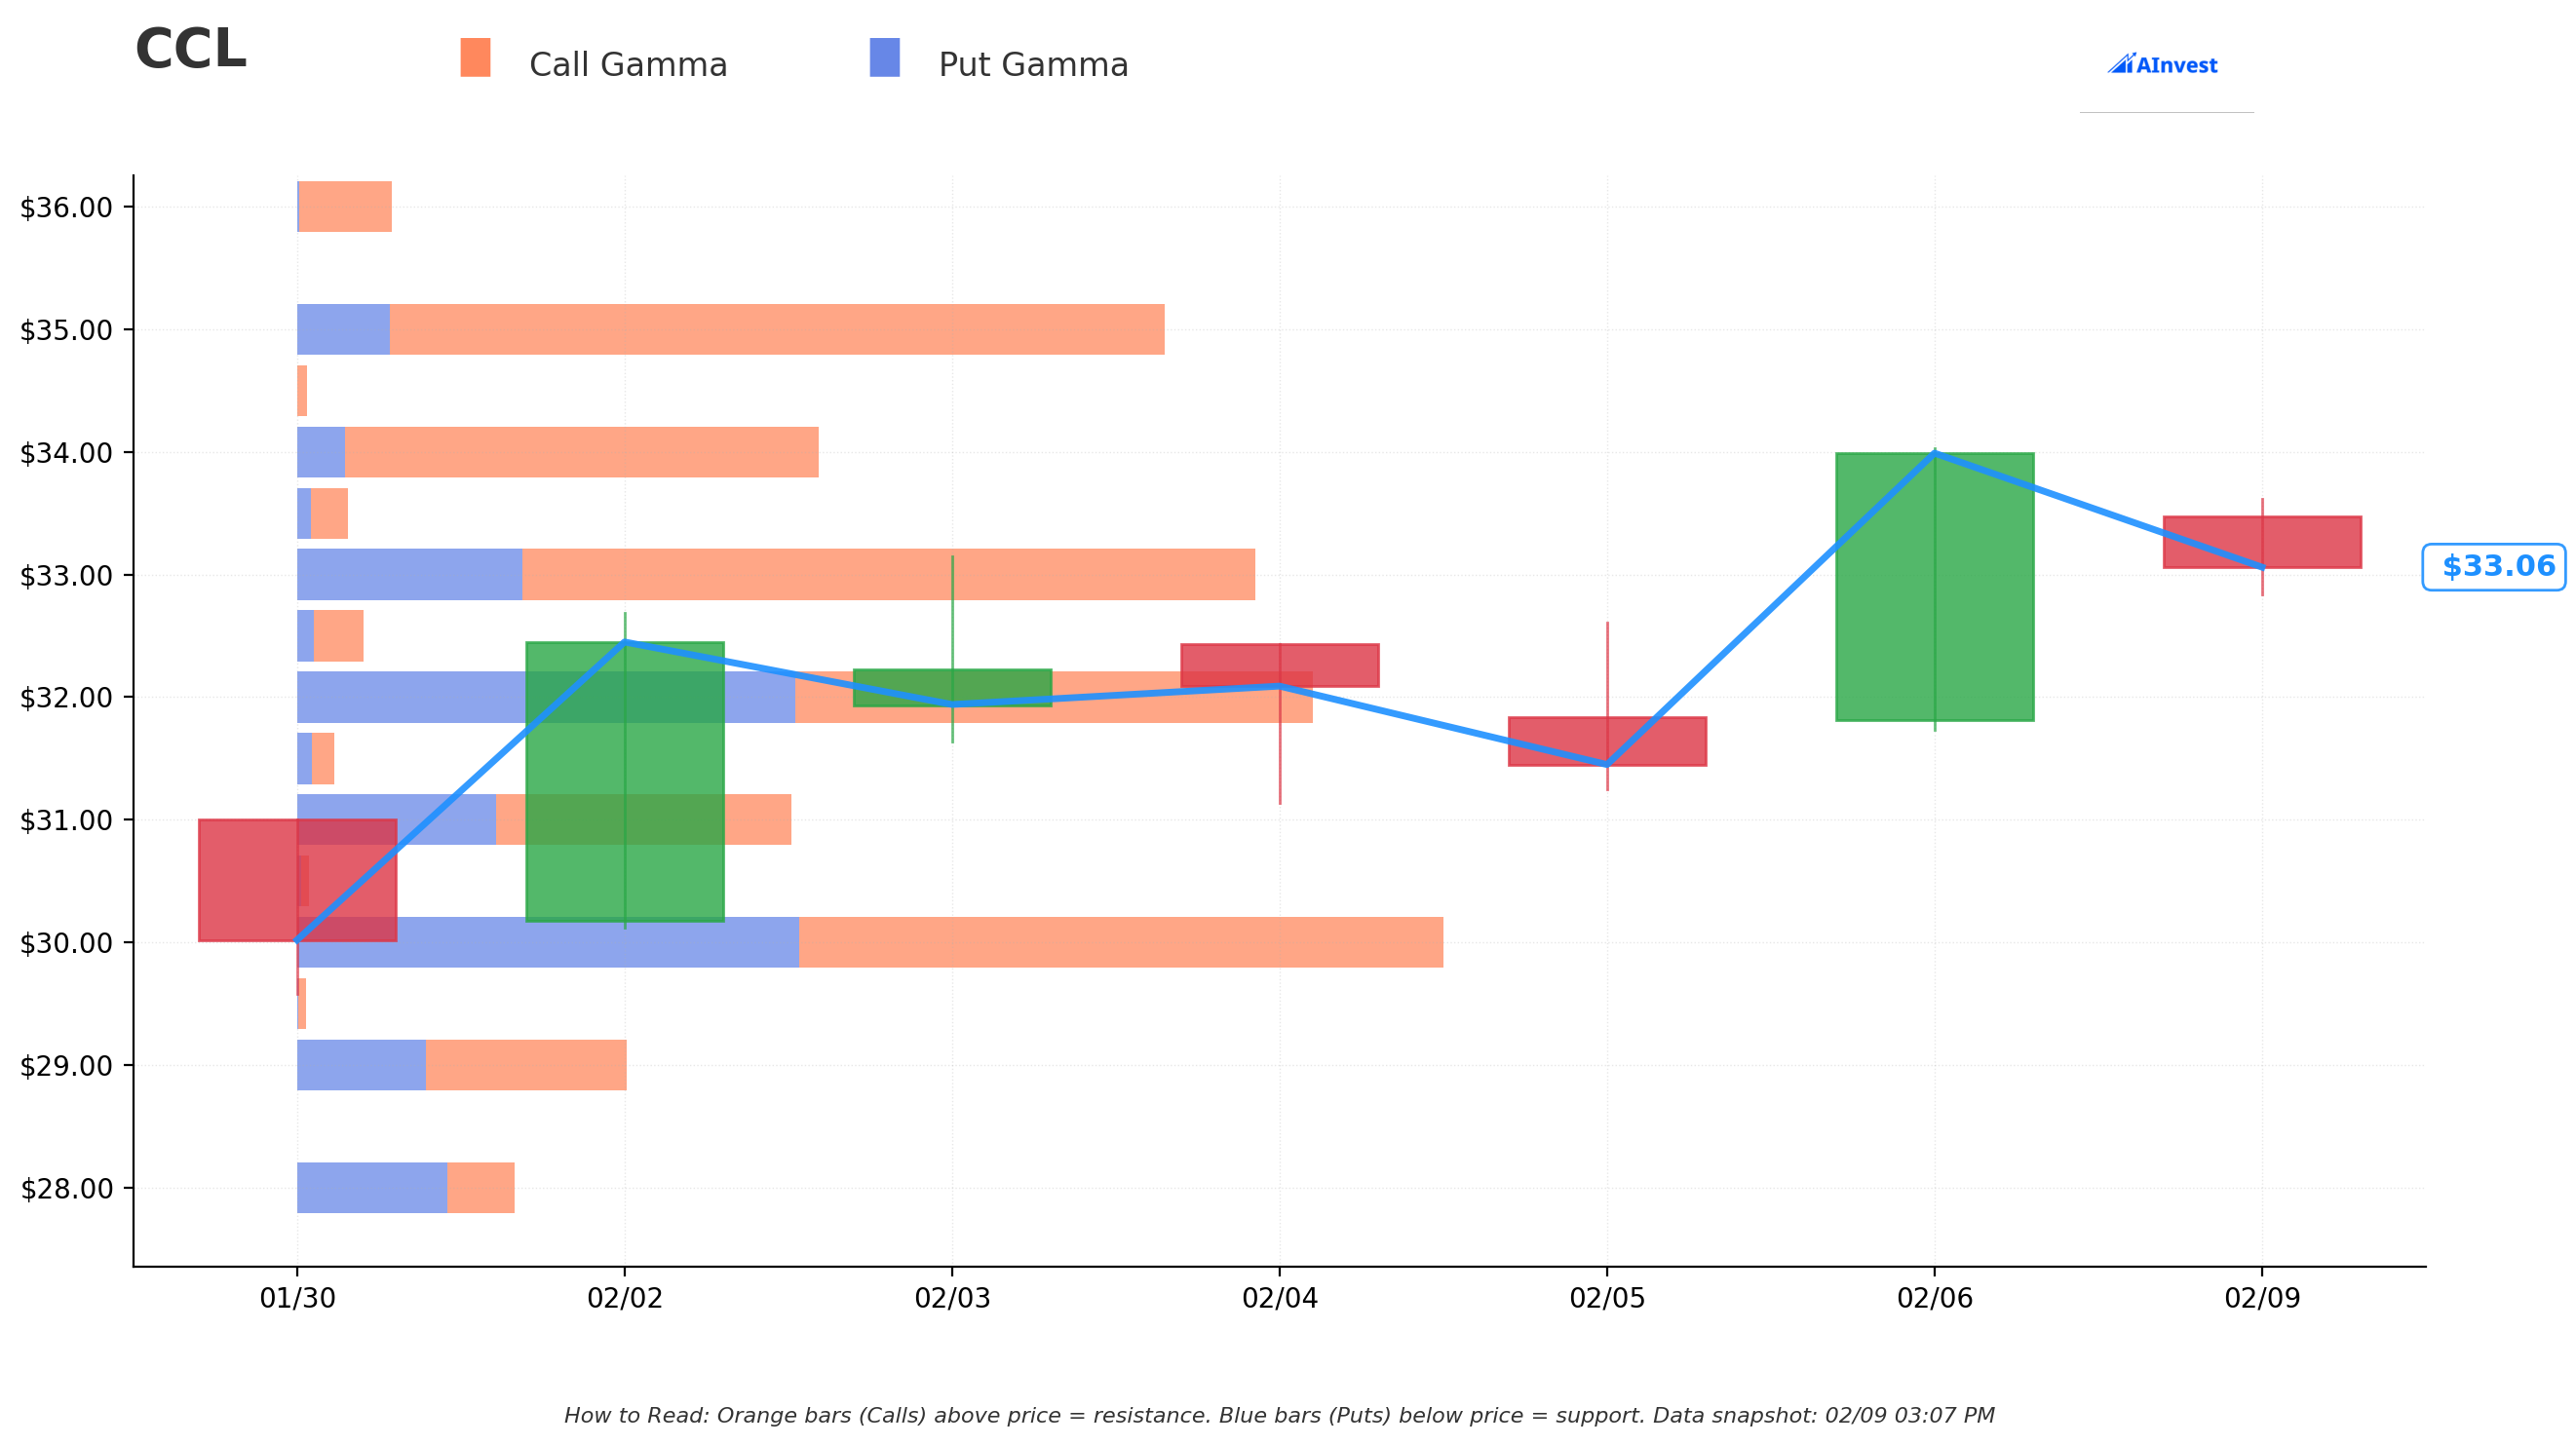
Based on dealer gamma positioning, here are the key levels to watch:
🛡️ Support Levels (Put Gamma / Blue Bars):
| Strike | Distance from Spot | Put GEX | Strength |
|---|---|---|---|
| $33.00 | -0.13% | 3.33 | STRONGEST SUPPORT |
| $32.00 | -3.16% | 7.35 | High |
| $31.00 | -6.19% | 2.94 | Moderate |
| $30.00 | -9.21% | 7.40 | PUT TARGET STRIKE |
| $29.00 | -12.24% | 1.90 | Light |
| $28.00 | -15.27% | 2.21 | Moderate |
🚧 Resistance Levels (Call Gamma / Orange Bars):
| Strike | Distance from Spot | Call GEX | Strength |
|---|---|---|---|
| $34.00 | +2.89% | 6.99 | NEAREST RESISTANCE |
| $35.00 | +5.92% | 11.42 | MAJOR RESISTANCE |
| $37.00 | +11.97% | 2.63 | Light |
📊 Net GEX Bias: Bullish (Total Call GEX: 74.4 vs Put GEX: 41.6)
Translation for us regular folks: Dealers are net long gamma, which means they'll be selling into rallies and buying dips - this tends to compress volatility and support the $33-$35 range. However, if $33 breaks, the next major support is way down at $30 - exactly where our whale placed their bet!
📉 Implied Move Analysis
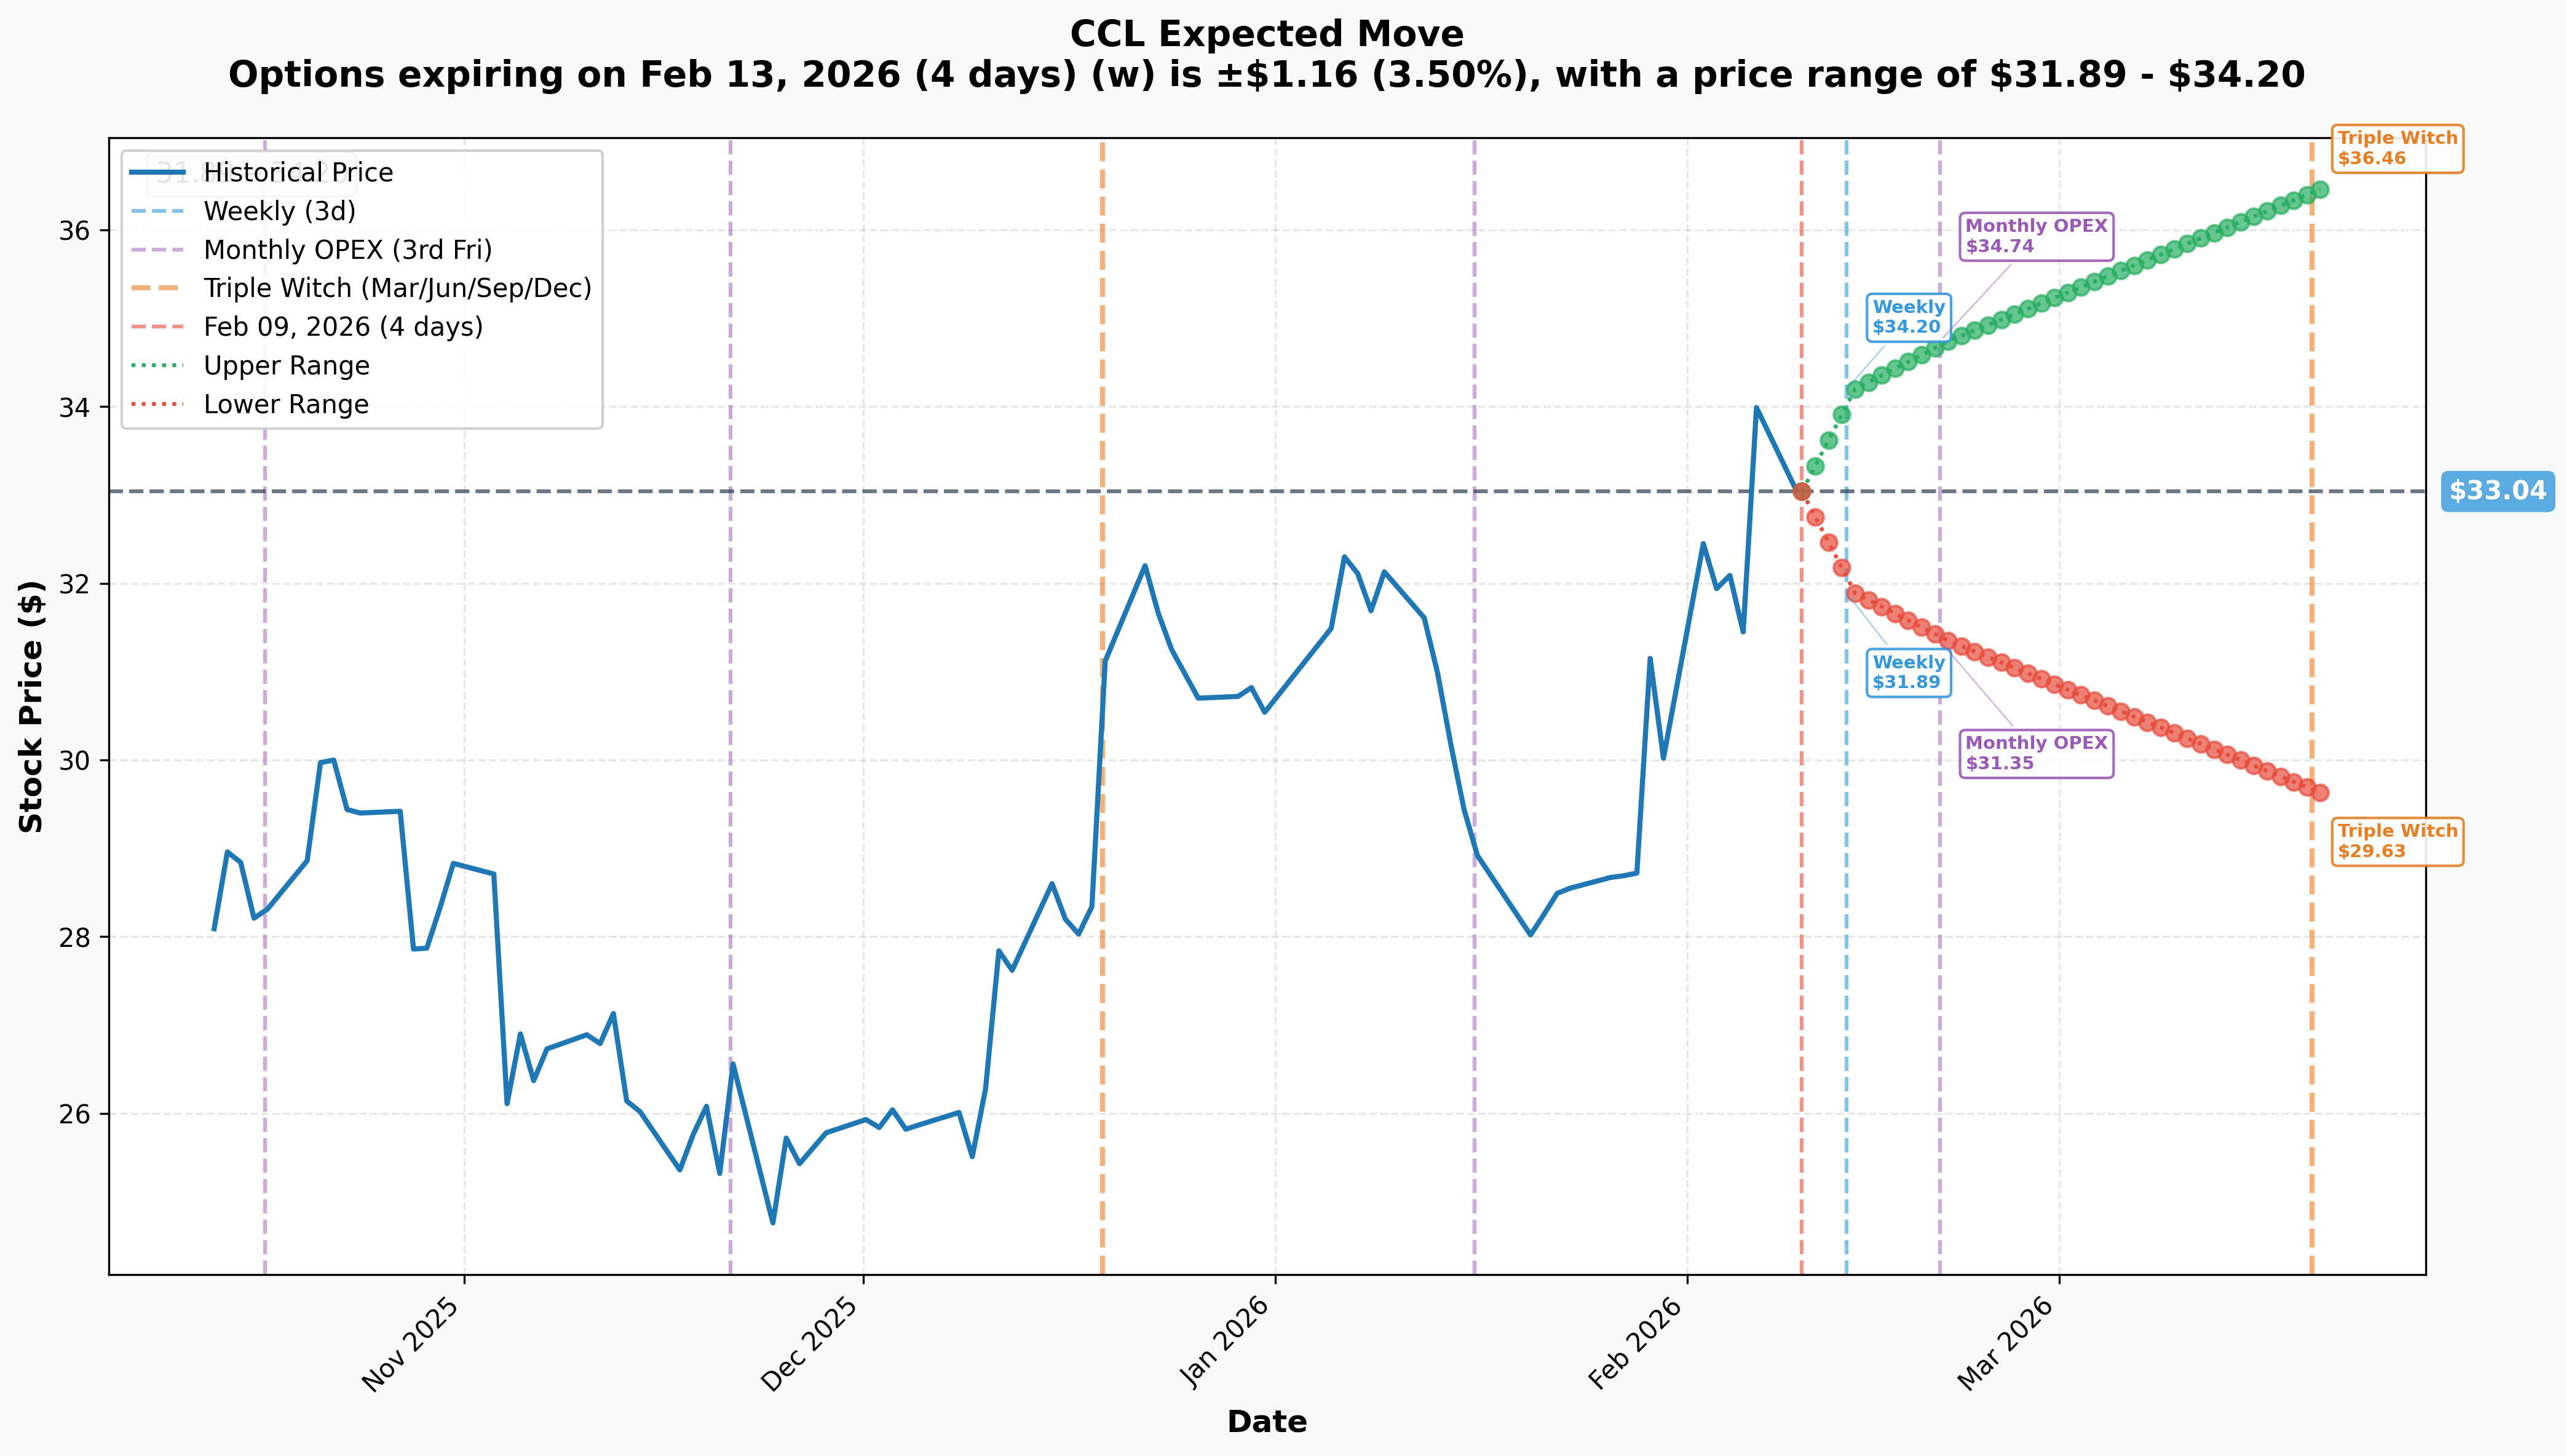
| Timeframe | Expiry | Days Out | Implied Move | Price Range |
|---|---|---|---|---|
| Weekly | 2026-02-13 | 4 days | ±3.5% | $31.89 - $34.20 |
| Monthly OPEX | 2026-02-20 | 11 days | ±5.13% | $31.35 - $34.74 |
| Triple Witch | 2026-03-20 | 39 days | ±10.34% | $29.63 - $36.46 |
The March Triple Witch implied move of ±10.34% gives a range of $29.63 - $36.46, which encompasses both our whale's $30 put strike AND the $35 resistance level.
🎪 Catalysts
📅 Upcoming Events
| Date | Event | Significance |
|---|---|---|
| Feb 13, 2026 | Dividend Record Date | First dividend since COVID - $0.15/share |
| Feb 27, 2026 | Dividend Payment | Bullish signal, attracts income investors |
| March 20, 2026 | Q1 2026 Earnings | Before market open - Consensus EPS: $0.19 |
| April 17, 2026 | Dual-Listing Unification Vote | NYSE-only consolidation |
| Summer 2026 | Half Moon Cay Expansion | Major destination enhancement begins |
📜 Recent Events (Already Happened)
| Date | Event | Impact |
|---|---|---|
| Dec 19, 2025 | Q4 FY2025 Record Results | Beat EPS $0.34 vs $0.25 consensus (+36%) |
| Dec 19, 2025 | Dividend Reinstatement | First since COVID, signaling confidence |
| Jan 12, 2026 | Bank of America PT Upgrade | Raised from $40 to $45 (Buy) |
🎲 Price Targets & Probabilities
Based on gamma levels, implied move analysis, and the catalyst calendar:
🐂 Bull Case: $35.00 - $36.50
- Probability: 35%
- Catalysts Required: Clean Q1 earnings beat, successful unification vote approval, continued strong booking trends
- Gamma Context: $35 is the major call gamma wall with 11.42 GEX - expect significant resistance here
- Implied Move: Triple Witch upper range at $36.46 aligns with analyst price targets (median $38)
⚖️ Base Case: $32.00 - $34.00
- Probability: 45%
- Scenario: Stock consolidates near current levels, digesting gains while awaiting Q1 earnings
- Gamma Context: Heavy two-way gamma at $33-$34 creates natural trading range
- Support: $33 is strongest gamma support at current price
🐻 Bear Case: $29.00 - $31.00
- Probability: 20%
- Catalysts: Earnings miss, guidance cut, consumer spending concerns, fuel cost spike
- Gamma Context: If $32 breaks, limited support until $30 - exactly our whale's target
- Implied Move: Triple Witch lower range at $29.63 validates the $30 put strike
💡 Trading Ideas
🛡️ Conservative: "The Dividend Collector"
Strategy: Cash-Secured Put at $31 Strike
| Parameter | Details |
|---|---|
| Trade | Sell CCL Mar 20, 2026 $31 Put |
| Premium | ~$0.85 (estimated) |
| Max Risk | $31/share (if assigned) |
| Breakeven | $30.15 |
| Why This Works | Collect premium while waiting to buy at 6% discount. $31 is a gamma support level. You're paid to wait for a pullback that may never come. If assigned, you own CCL at a great price with dividend coming. |
⚖️ Balanced: "The Earnings Strangle Rider"
Strategy: Long Put Spread Financed by Call Spread (Iron Condor Variation)
| Parameter | Details |
|---|---|
| Trade | Buy Mar 20 $32/$30 Put Spread + Sell Mar 20 $35/$37 Call Spread |
| Net Cost | ~$0.50 debit (estimated) |
| Max Gain | $1.50 (if CCL below $30 or above $35 at earnings) |
| Max Loss | $0.50 premium paid |
| Why This Works | Plays the ±10.34% implied move around Q1 earnings. You profit if CCL makes a big move either direction. The call spread caps upside but reduces cost. Defined risk, multiple ways to win. |
🚀 Aggressive: "Follow the Whale"
Strategy: Long Put with Longer Duration
| Parameter | Details |
|---|---|
| Trade | Buy CCL Jul 17, 2026 $30 Put |
| Cost | ~$2.40 per contract ($240 per contract) |
| Max Risk | Premium paid |
| Breakeven | $27.60 at expiration |
| Why This Works | You're shadowing a $1.8M institutional bet with 158 days runway. If CCL has any stumble - earnings miss, macro concerns, fuel spike - this put could double. The whale clearly sees value in this strike. |
Risk Warning: This is a speculative directional bet. You need CCL to drop ~17% from current levels to hit breakeven. Only for traders with high risk tolerance!
⚠️ Risk Factors
🚨 For Put Buyers (Bearish Thesis Risks):
✅ Strong Demand Visibility - According to AInvest analysis, two-thirds of 2026 capacity is already booked at record prices with $7.2B in customer deposits
✅ Dividend Support - First dividend since COVID signals management confidence; income investors provide floor
✅ Analyst Bullishness - 21 Buy ratings vs 0 Sell with median $38 price target per Yahoo Finance
✅ Net Bullish Gamma - Dealer positioning favors range compression and dip-buying
🚨 For Call Buyers / Stock Holders (Bullish Thesis Risks):
❌ Debt Mountain - Per TipRanks risk analysis, $26-28B in total debt with 2.17x debt-to-equity ratio
❌ Liquidity Concerns - Current ratio of just 0.34x indicates limited short-term buffer
❌ Fuel Cost Sensitivity - Ship operating costs show fuel is 15-25% of expenses; oil volatility hits margins
❌ Consumer Discretionary Risk - Travel Weekly notes cruise stocks dropped 11-16% during tariff concerns
❌ Premium Valuation - At 12x forward P/E, CCL trades richer than Norwegian (9x) per Yahoo Finance comparison
🎯 The Bottom Line
Real talk: Someone just paid $1.8M for downside protection on CCL, and we need to figure out if they're a genius or just paranoid.
Here's my read:
📊 If you're bullish on CCL: This put activity is likely institutional hedging, not a directional bet. With the stock at 52-week highs, record earnings, and a reinstated dividend, it makes sense for large holders to buy protection before Q1 earnings. The bullish gamma bias and strong booking visibility support the long case. Consider selling puts at support levels ($31-$32) to generate income.
📊 If you're neutral/watching: The March 20 earnings and April 17 unification vote are your decision points. Wait for post-earnings clarity before committing. The implied move of ±10.34% by Triple Witch suggests the market expects fireworks.
📊 If you're bearish: Following this whale makes sense if you believe:
- Q1 earnings disappoints (EPS consensus $0.19 is low bar)
- Consumer spending weakens heading into summer
- Fuel costs spike unexpectedly
- Debt concerns resurface
Mark Your Calendar:
- 📅 Feb 13 - Dividend record date (potential pre-dividend selling)
- 📅 March 20 - Q1 Earnings (the big catalyst)
- 📅 April 17 - Unification vote (structural event)
The Takeaway: A $1.8M put purchase at 52-week highs deserves respect, but don't ignore the overwhelming bullish setup. The smart money might be hedging, not betting. Use gamma levels ($33 support, $35 resistance) as your guide and let earnings tell the real story.
Disclaimer: This analysis is for informational purposes only and does not constitute investment advice. Options trading involves substantial risk and is not suitable for all investors. You can lose your entire investment. Past unusual options activity is not indicative of future results. Always do your own research and consult a financial advisor before making trading decisions.