DVA Unusual Options Activity Analysis
Date: February 10, 2026 Ticker: DVA | Sector: Healthcare Services - Dialysis Current Price: $140.47 | Market Cap: $9.68B
Executive Summary
A sophisticated institutional trader executed a Bear Call Spread on DaVita Inc. (DVA) collecting approximately $2.3 million in net premium. The strategy involves selling 2,341 contracts of the Feb 20 $115 calls while simultaneously purchasing 2,341 contracts of the Feb 20 $125 calls for protection. With Q1 2026 earnings scheduled for February 18, 2026 (two days before expiration), this is a high-conviction bearish bet that DVA will not sustain its post-Q4 rally above the $115-$125 zone through expiration.
Key Thesis: The trader is betting that DVA's 28.8% post-earnings rally has overextended the stock, and the upcoming Q1 earnings will either disappoint or fail to provide sufficient catalyst for continued upside. Maximum profit is achieved if DVA closes below $115 at February 20 expiration.
Trade Details
Leg 1: Short Call (Premium Collection)
| Attribute | Value |
|---|---|
| Option | DVA20260220C115 |
| Direction | SELL |
| Strike | $115 |
| Premium | $25.69 |
| Size | 2,341 contracts |
| Notional | ~$6.0M |
| Open Interest | 3,100 |
| Volume | 2,400 |
Leg 2: Long Call (Protection)
| Attribute | Value |
|---|---|
| Option | DVA20260220C125 |
| Direction | BUY |
| Strike | $125 |
| Premium | $15.81 |
| Size | 2,341 contracts |
| Notional | ~$3.7M |
| Open Interest | 2,500 |
| Volume | 2,300 |
Strategy Metrics
| Metric | Value |
|---|---|
| Strategy | Bear Call Spread |
| Net Premium Collected | ~$2.31M ($25.69 - $15.81 = $9.88 x 2,341 x 100) |
| Max Profit | $2.31M (if DVA < $115 at expiration) |
| Max Loss | ~$7.69M ($10 spread width - $2.31M premium) |
| Breakeven | $124.88 (short strike + net credit per share) |
| Risk/Reward | 3.3:1 (risk $7.69M to make $2.31M) |
| Days to Expiration | 10 |
| Probability of Profit | ~70% (DVA needs to stay below $124.88) |
Market Context
YTD Performance
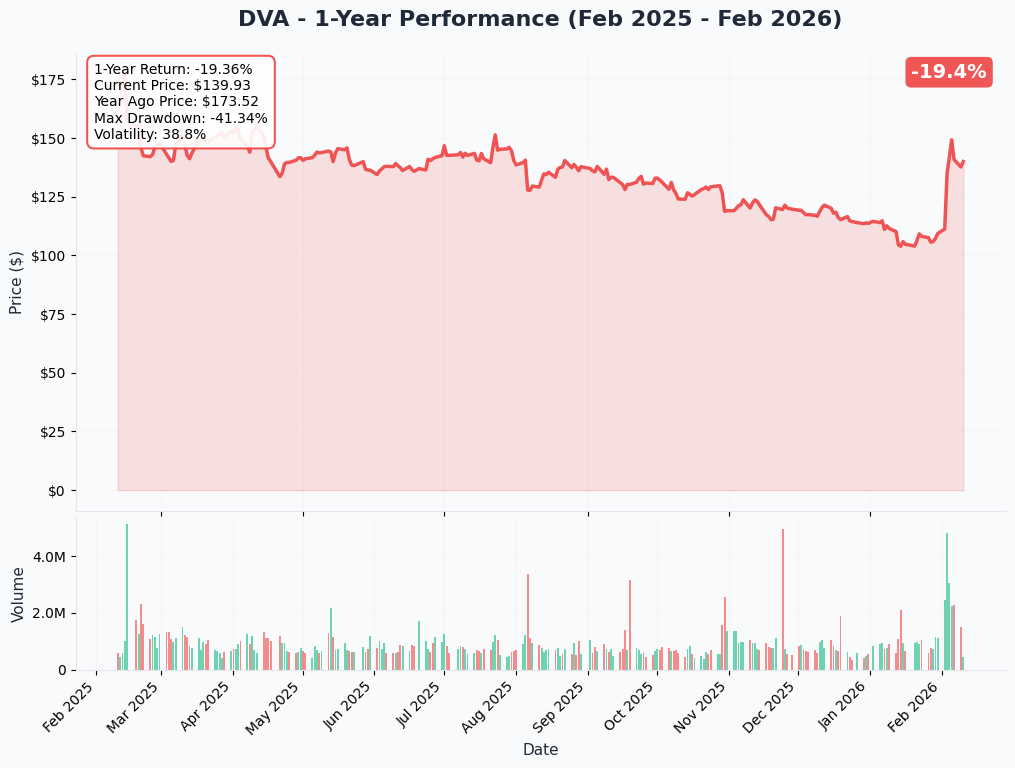
DVA has experienced significant volatility in 2026, rallying 28.8% following the Q4 2025 earnings beat and strong FY 2026 guidance. The stock currently trades at $140.47, well above both the short ($115) and long ($125) strikes, indicating this spread is currently in maximum loss territory.
Technical Levels
| Level | Price | Significance |
|---|---|---|
| 52-Week High | $178.38 | Resistance |
| Current Price | $140.47 | Trading above spread strikes |
| Long Strike | $125.00 | Protection level (max loss cap) |
| Breakeven | $124.88 | Trader profit zone begins |
| Short Strike | $115.00 | Max profit if below |
| 52-Week Low | $101.00 | Major support |
Gamma Exposure & Support/Resistance
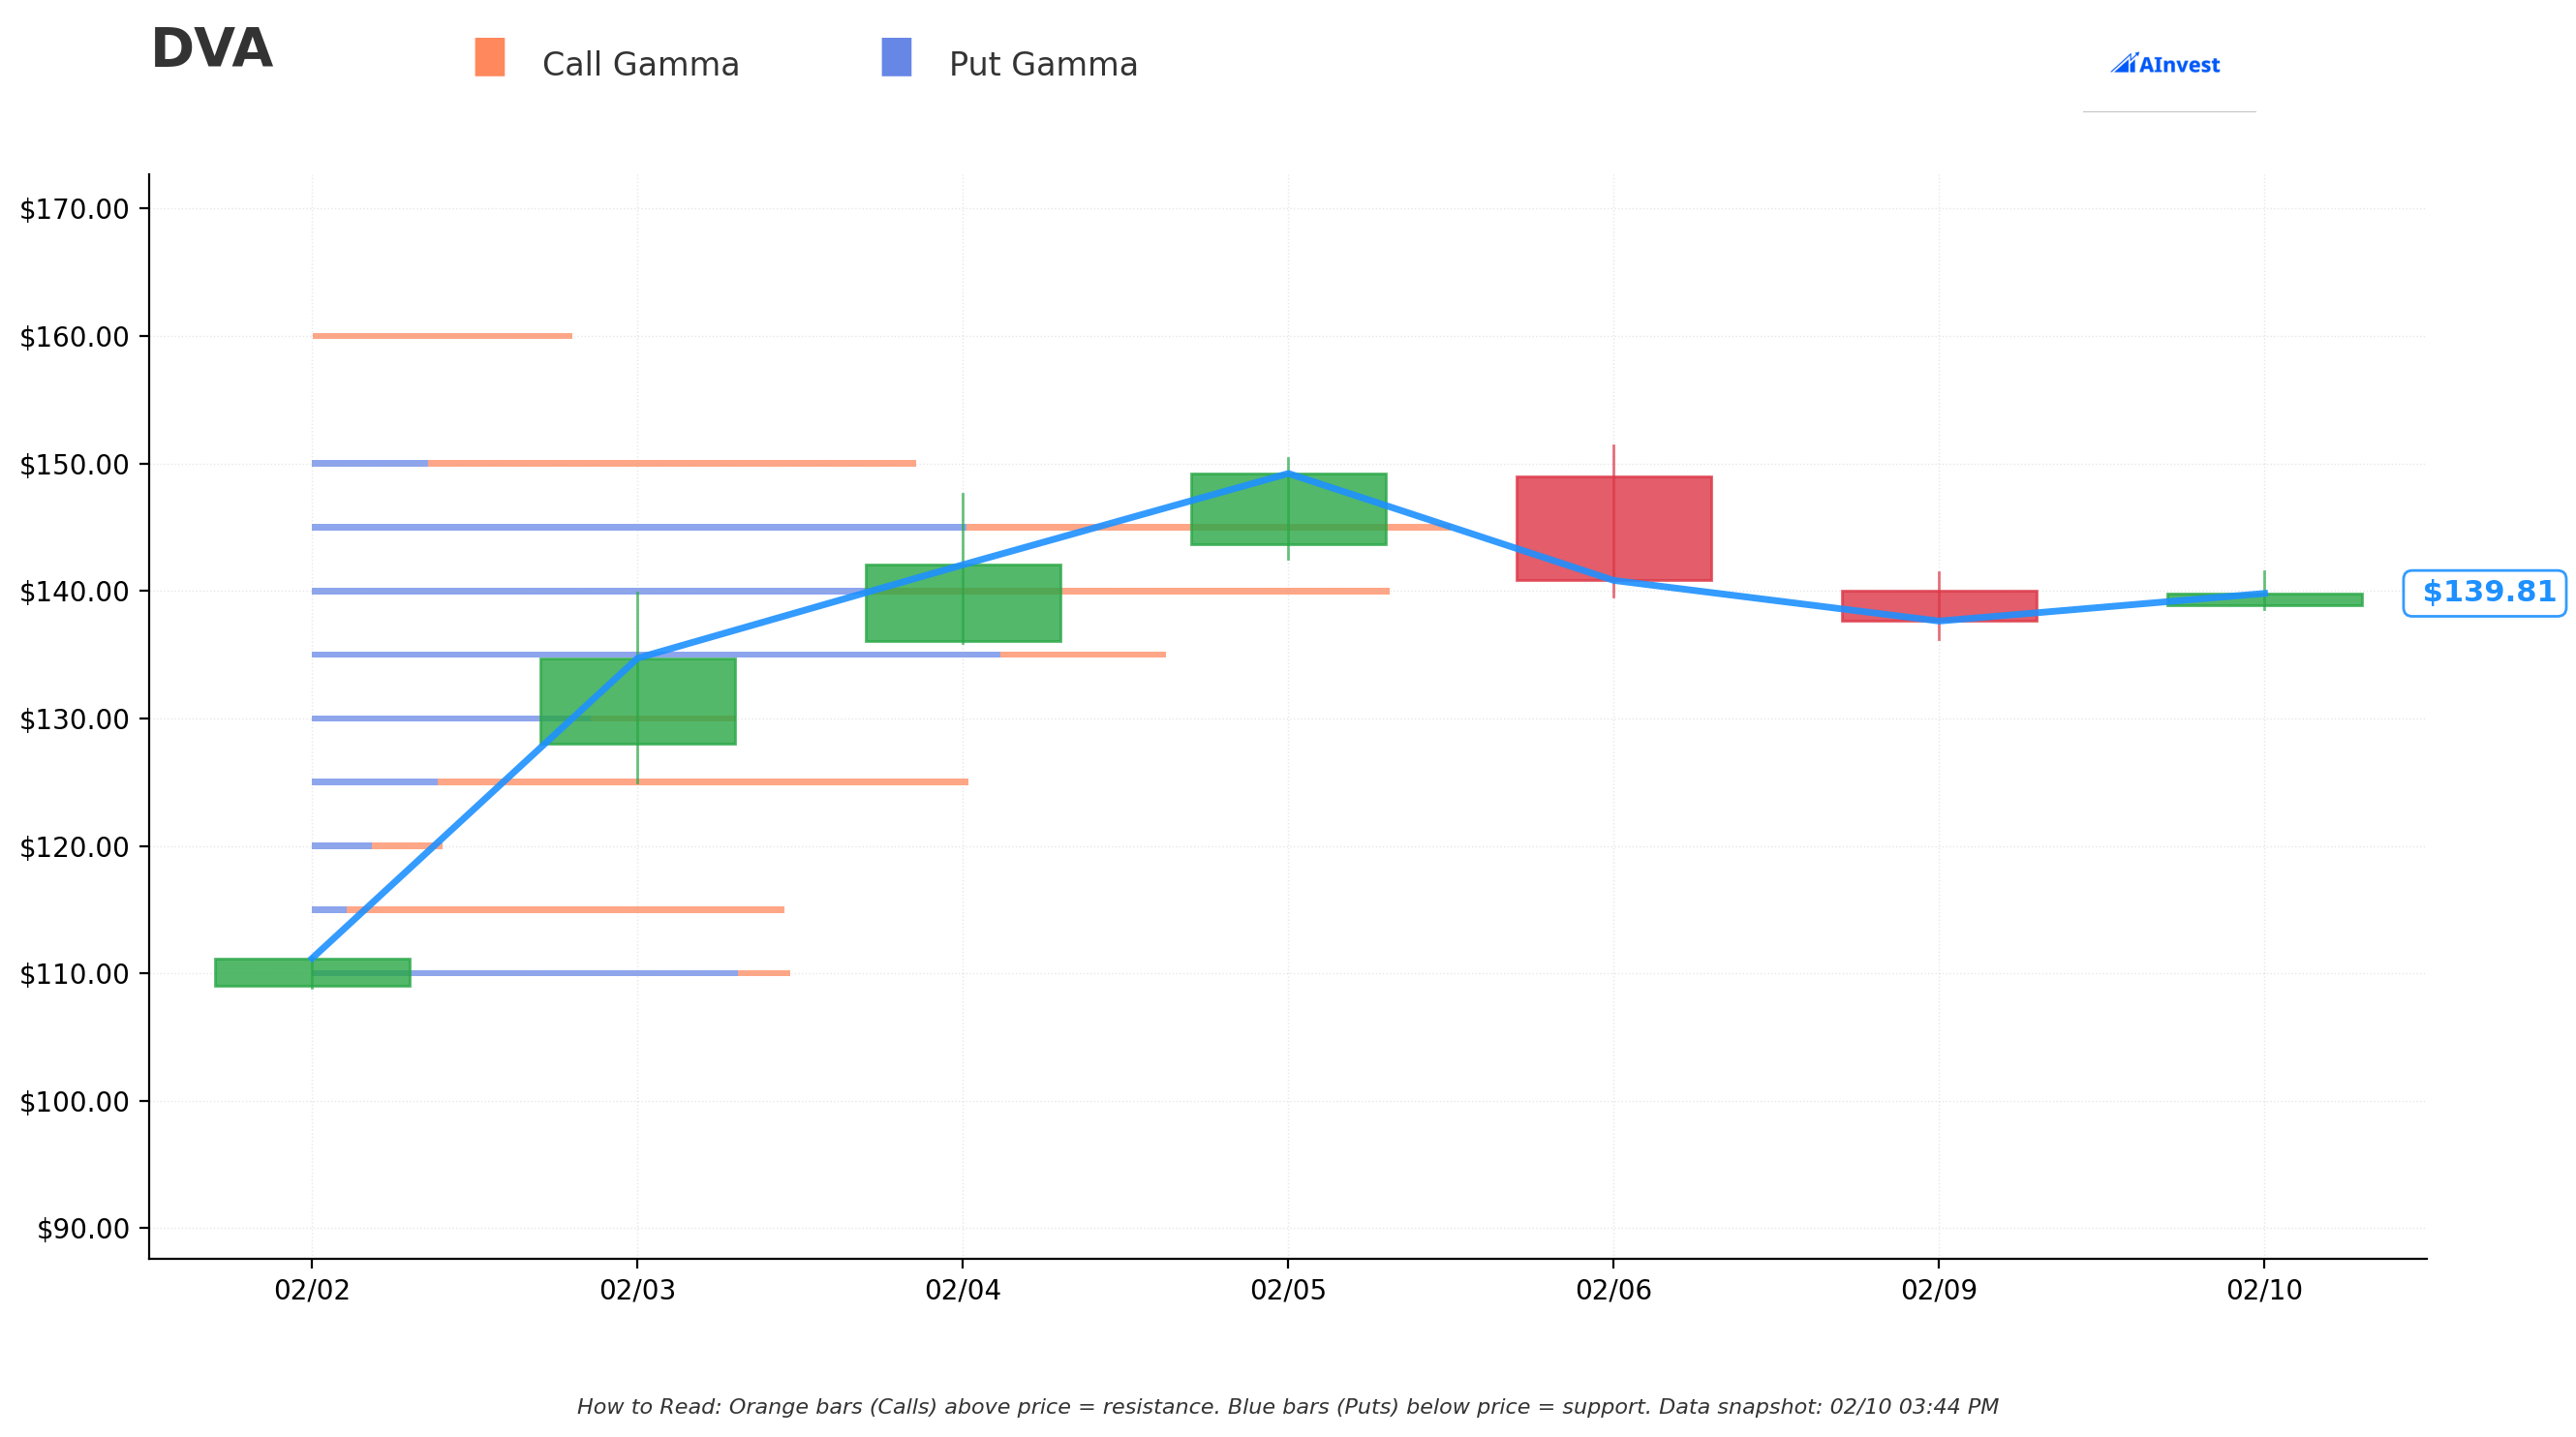
The gamma profile suggests significant dealer positioning around the $115-$125 strike zone. If DVA begins declining toward these levels, dealer hedging activity could accelerate the move, benefiting this trade.
Implied Volatility Analysis
Implied Move Framework
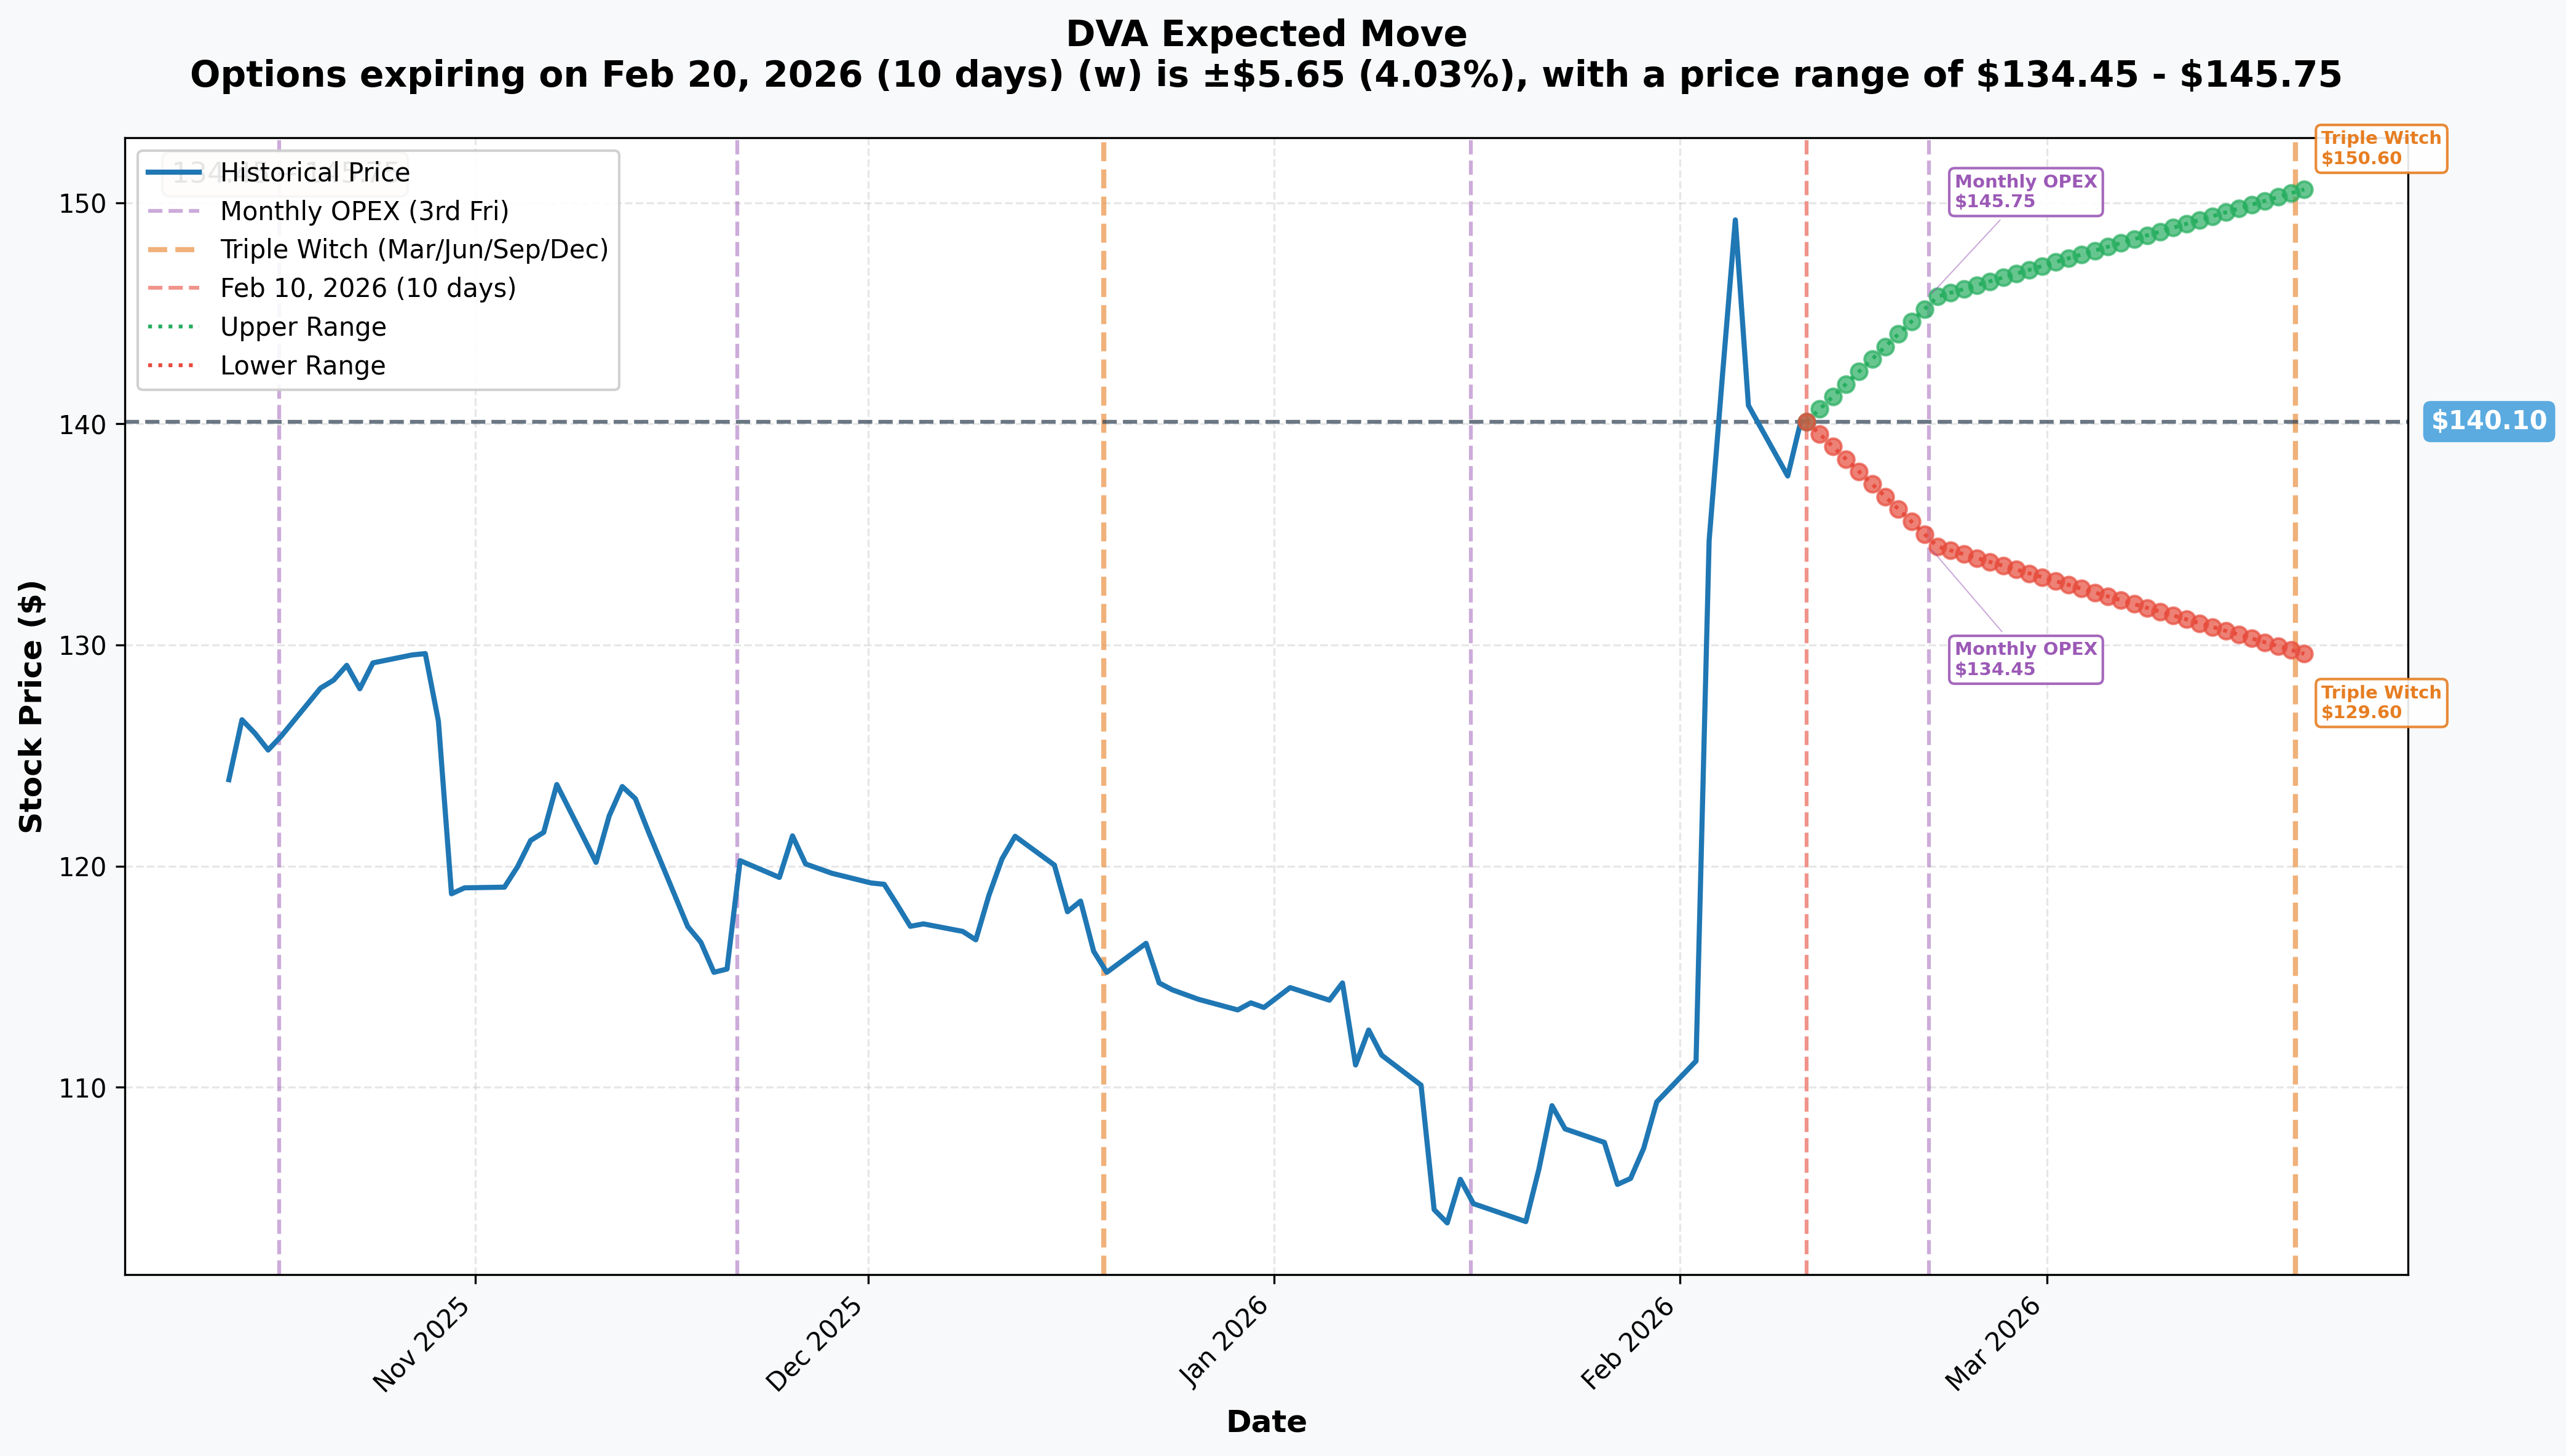
| Timeframe | Expiry | Days | Implied Move % | Range |
|---|---|---|---|---|
| Feb Monthly OPEX | 2026-02-20 | 10 | 4.03% | $134.45 - $145.75 |
| March Triple Witch | 2026-03-20 | 38 | 7.49% | $129.60 - $150.60 |
Critical Observation: The Feb 20 implied move range of $134.45 - $145.75 encompasses the current price ($140.47) but the short strike ($115) sits $19.45 below the lower implied range. This means:
- The market is pricing only a 4% move through Feb 20 expiration
- For DVA to reach $115, it would need to decline 18.1% - roughly 4.5x the implied move
- The trader is collecting premium on a strike with very low probability of being tested
Volatility Edge: The trader appears to be selling overpriced volatility at the $115 strike, which has minimal probability of being breached based on current implied move pricing. The $125 strike protection is prudent risk management given the Q1 earnings event.
Catalyst Analysis
Imminent: Q1 2026 Earnings (February 18, 2026)
This is the critical event for this trade. Earnings release is scheduled for after market close on February 18, just 2 trading days before option expiration.
| Metric | Consensus | Prior Year | YoY Growth |
|---|---|---|---|
| EPS | $2.41 | $2.00 | +20.5% |
Risk Assessment: The strategy expires through earnings, creating binary event risk. However, the deep-in-the-money nature of the short strike ($115 vs. $140 spot) provides substantial cushion. DVA would need to:
- Drop 25.5 points ($140 to ~$115) for full profit
- Drop 15.5 points ($140 to ~$125) to reach max loss zone
Recent Catalysts Already Priced In
Per the DVA catalyst research:
- Q4 2025 Beat: Adjusted EPS $3.40 vs. $3.24 consensus (+51.8% YoY)
- FY 2026 Guidance: $13.60-$15.00 adjusted EPS, 12-18% above Street
- Medicare Rate Increase: 2.2% reimbursement bump effective Jan 2026
- Elara Caring Investment: $200M minority stake announced Feb 2
Bearish Headwinds Supporting the Trade
- Volume Decline: U.S. dialysis treatment volume fell 1.1% in 2025 with flat 2026 guidance
- Cost Pressures: Patient care costs rose 5.9% vs. 4.7% RPT growth
- ACA Subsidy Expiration: $40M headwind from enhanced premium tax credit expiration
- Valuation Stretch: Stock up 29% post-earnings, trading at upper analyst targets
- Analyst Sentiment: Only 1 Buy rating out of 10 analysts; median PT $160.50 (Public.com)
Institutional Flow Interpretation
Trade Characteristics
| Indicator | Assessment |
|---|---|
| Size | Institutional (2,341 contracts, ~$2.3M premium) |
| Timing | Executed simultaneously at 13:09:31 |
| Execution | Single fill suggests block desk or direct market access |
| OI Impact | Significant vs. prior OI (3,100 and 2,500) |
| Spread Width | $10 (standard institutional sizing) |
Position Intent Analysis
Most Likely Interpretation: Bearish Premium Collection
- Not a hedge: Position size too large relative to typical equity hedge ratios
- Not covered: Would require $27M+ in underlying stock exposure
- Directional bet: Clean bear call spread structure with defined risk
Alternative Interpretation: Earnings Volatility Fade
The trader may be betting that implied volatility ahead of Feb 18 earnings is overstated. By selling the spread, they profit from:
- Time decay (10 days to expiration)
- Volatility contraction post-earnings
- Range-bound price action between $125-$145
Risk/Reward Scenarios
Scenario Analysis at February 20 Expiration
| DVA Price | Short $115C Value | Long $125C Value | Net P&L | Return on Risk |
|---|---|---|---|---|
| < $115 | $0 | $0 | +$2.31M | +100% (max profit) |
| $115 | $0 | $0 | +$2.31M | +100% |
| $120 | $5 | $0 | +$1.14M | +49% |
| $124.88 | $9.88 | $0 | $0 | Breakeven |
| $125 | $10 | $0 | -$28K | -1.2% |
| $130 | $15 | $5 | -$2.31M | -30% |
| $135 | $20 | $10 | -$2.31M | -30% |
| > $125 | ITM | ITM | -$7.69M | -100% (max loss) |
Probability Distribution
Based on implied move data and current positioning:
| Outcome | Probability | P&L |
|---|---|---|
| Max Profit (< $115) | ~15% | +$2.31M |
| Partial Profit ($115-$125) | ~20% | +$0.5M to +$2.3M |
| Breakeven Zone (~$125) | ~10% | ~$0 |
| Loss Zone (> $125) | ~55% | -$0 to -$7.69M |
Expected Value: Given current positioning (DVA at $140), the trade is currently at max loss. However, with 10 days and earnings ahead, significant movement is possible.
Company Profile
DaVita Inc. (NYSE: DVA)
| Attribute | Detail |
|---|---|
| Headquarters | Denver, CO |
| Employees | 76,000 |
| Founded | 1994 |
| Website | davita.com |
| SIC | 8090 - Health & Allied Services |
Business Description: DaVita is the largest provider of dialysis services in the United States with approximately 35% market share. The company operates over 3,242 outpatient dialysis centers globally, serving ~295,000 patients annually. Approximately two-thirds of U.S. revenues derive from government (primarily Medicare) reimbursement, with commercial insurers accounting for the remainder despite representing only ~10% of patients treated.
Ownership Structure
| Holder | Shares | % Ownership |
|---|---|---|
| Berkshire Hathaway | 31.76M | 45.0% |
| Vanguard Group | 4.21M | 6.0% |
| BlackRock | 2.40M | 3.4% |
| Total Institutional | — | 95.4% |
Trading Implications
For the Detected Trade
Optimal Outcome: DVA pulls back sharply following Q1 earnings disappointment, declining below $115 by Feb 20.
Worst Case: DVA rallies further on strong Q1 results, sustaining above $125 through expiration.
Hedge Consideration: Given the trade is currently at max loss, the institutional trader may:
- Already have additional hedges in place
- Be prepared to roll or adjust post-earnings
- Have conviction in mean reversion thesis
For Other Traders Considering DVA
Bullish Thesis Challenges:
- Stock has rallied 29% in 8 days, limiting near-term upside
- Only 1 analyst Buy rating, 7 Holds, 1 Sell
- Volume headwinds persist with flat 2026 guidance
Bearish Thesis Support:
- Overextended post-earnings rally vulnerable to profit-taking
- Cost inflation outpacing reimbursement growth
- FTC regulatory scrutiny creates headline risk
Key Takeaways
-
Large Institutional Bet: $2.3M premium collection on a bear call spread signals sophisticated conviction that DVA is overextended
-
Earnings Binary Event: The trade expires 2 days after Q1 earnings (Feb 18), creating asymmetric risk/reward
-
Implied Move Mismatch: The $115 short strike sits 4.5x below the implied move range, suggesting the trader views downside risk as underpriced
-
Current Status: Trade is at max loss with DVA at $140 vs. $125 long strike; requires significant pullback to profit
-
Thesis: Post-earnings rally exhaustion, mean reversion, or Q1 disappointment could drive DVA back toward $115-$125 zone
Sources & References
- DaVita Q4 2025 Results
- DaVita Stock Rally Analysis - Simply Wall St
- CMS Dialysis Rate Increase - Healio
- Elara Caring Investment - Home Health Care News
- DVA Earnings Calendar - TipRanks
- DVA Analyst Ratings - Public.com
- DVA Ownership - TIKR
- FTC Investigation - Fierce Healthcare
Analysis generated February 10, 2026. Options trading involves substantial risk. This analysis is for informational purposes only and does not constitute investment advice.