🐻 GLD $7.8M Long Put Bet — Whale Fades Gold's Bull Run Through November
📅 May 1, 2026 | 🔥 Unusual Activity Detected
🎯 The Quick Take
Someone just laid out $7.8 MILLION betting that gold goes lower by November — dropping two massive put orders on SPDR Gold Shares (GLD) within 25 seconds of each other at the $420 strike expiring November 20, 2026. With spot gold off roughly -15% from its January all-time high of ~$5,595/oz and GLD trading at $427.78 on the tape, this whale is betting the correction has more room to run — or at minimum wants serious downside protection through the critical June 16-17 FOMC meeting. This isn't your neighbor's Robinhood account — this is institutional conviction that gold's historic bull run could roll over. 👀
📊 ETF Overview
SPDR Gold Shares (GLD) is the world's largest physically-backed gold exchange-traded fund, launched November 18, 2004 by State Street Global Advisors:
- 🏛️ Exchange: NYSE Arca (primary listing)
- 💰 AUM: ~$155.11 billion (as of April 29, 2026)
- 🪙 Gold Holdings: 1,039.20 tonnes of allocated London Good Delivery bars in HSBC vaults
- 📊 Expense Ratio: 0.40%
- 🌍 Global Gold ETF Share: ~25% of the $606B global gold ETF market
- 📅 Inception: November 18, 2004 — the institutional gold-standard for spot gold exposure
GLD is the dominant vehicle for institutional gold exposure in the U.S. It essentially IS gold for most portfolio managers. When someone takes a $7.8M put position here, they're making a direct macro bet against the yellow metal.
💰 The Option Flow Breakdown
📊 The Tape (May 1, 2026)
| Time | Symbol | Buy/Sell | Type | Expiration | Strike | Volume | Premium | Order Type |
|---|---|---|---|---|---|---|---|---|
| 10:17:05 | GLD | BUY | PUT $420 | 2026-11-20 | $420 | 1,825 | $4.3M | BTO |
| 10:17:30 | GLD | BUY | PUT $420 | 2026-11-20 | $420 | 1,500 | $3.5M | BTO |
Combined Total: 3,325 contracts | $7.8M premium paid | Same strike, same expiry, 25 seconds apart
Both trades carry an EXTREMELY UNUSUAL Z-score — the first leg clocked a Z-score of 8.82 and the second hit 16.38. That kind of back-to-back print at the same strike in under 30 seconds is classic institutional scaling — a whale building a position in tranches to minimize market impact. This doesn't happen more than a handful of times a year in GLD options.
🤓 What This Actually Means
Real talk: this is a BTO (Buy to Open) — the trader paid premium out of pocket to open a brand new long put position. There is no credit collected here. They are spending real dollars for the right to profit if GLD falls.
Here is the trade math:
- 💸 Total premium paid: $7.8M ($4.3M + $3.5M) — this is pure money out of pocket
- 📉 Strike: $420 (GLD was ~$427.78 when the first leg printed, so the put is ~2% out-of-the-money)
- ⏰ Expiration: November 20, 2026 — roughly 6.5 months of runway
- 🎯 Breakeven at expiry: ~$396 ($420 strike minus the ~$23.40/contract average premium paid)
- 🏆 Maximum profit: Unlimited to the downside — if GLD falls to zero (theoretical), profit is uncapped
- 😰 Maximum loss: $7.8M total premium — only at risk if GLD stays above $420 on November 20, 2026
- 📊 Shares represented: 332,500 shares of GLD at risk (~$141M notional exposure at current prices)
Why the two-tranche approach? Splitting a $7.8M order into a $4.3M print and a $3.5M print 25 seconds later is a textbook institutional execution strategy. Throwing $7.8M at one bid would move the market against you. Breaking it into pieces is how smart money minimizes slippage. The fact that Z-scores of 8.82 and 16.38 were still registered — DESPITE being spread out — tells you just how unusual this volume is even broken into pieces.
Translation for regular traders: Someone just bought a very large insurance policy betting GLD goes below $420 by late November. If they're wrong and GLD is still above $420 in November, they lose the full $7.8M. If they're right and GLD falls to $396 or lower, they start making money. Below $396 is pure profit. This is NOT a casual trade — this is a high-conviction macro call or a hedge for a massive gold long position.
📈 Technical Setup / Chart Check-Up
YTD Performance
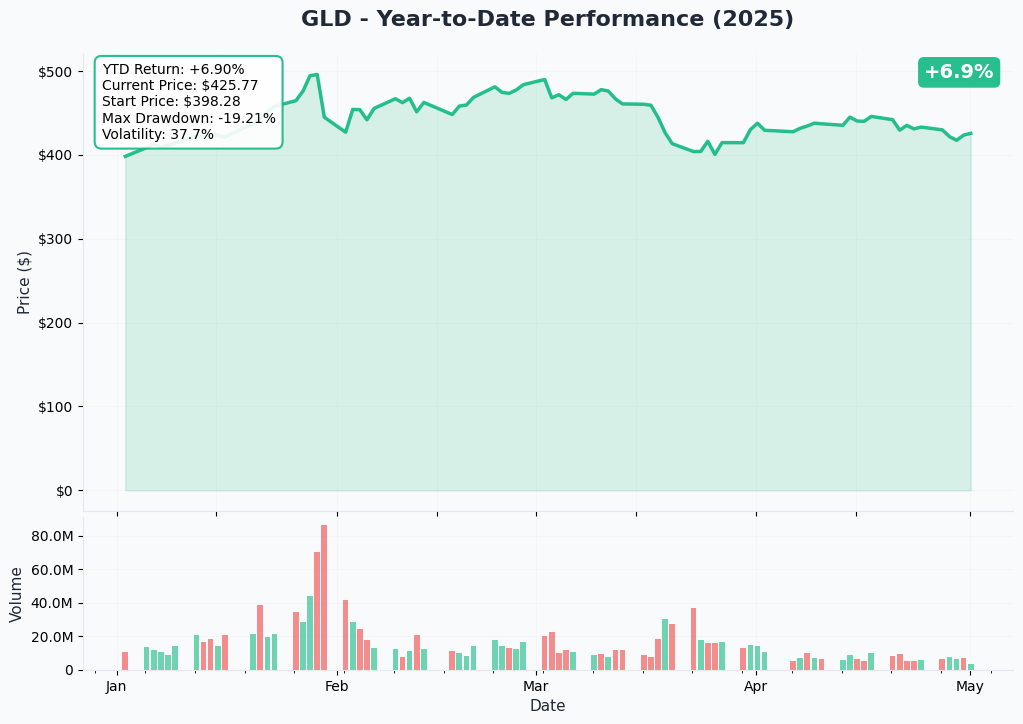
GLD started 2026 on fire, ripping to all-time highs early in the year as spot gold touched ~$5,595/oz in late January 2026. Since then the picture has changed — gold has corrected roughly -15% from that peak, and GLD closed April 30, 2026 at $417.41 before bouncing to the ~$427 area where this trade was placed.
Key observations from the YTD chart:
- 🚀 January spike to ATH: GLD printed all-time highs around late January 2026 when spot gold touched $5,595/oz — a historic move driven by geopolitical risk and safe-haven flows
- 📉 -15% correction: From the January ATH, gold corrected to around $4,728/oz by mid-April before a partial recovery
- 📊 April volatility: The April 28-29 FOMC hold at 3.50%-3.75% sparked a relief rally on April 30, but the broader trend off the January highs remains intact
- ⚠️ Structural concern: 10-year TIPS real yields near 1.94% create meaningful opportunity cost for non-yielding gold — this is the key macro headwind the put buyer is likely playing
The chart shows a classic "blow-off top, then correction" pattern. The January vertical move was extraordinary. The current ~$417-428 range represents a consolidation zone, but the trend from the January ATH is still down. Our put buyer appears to believe the next leg is lower, especially if the June FOMC disappoints gold bulls.
Gamma-Based Support & Resistance Analysis
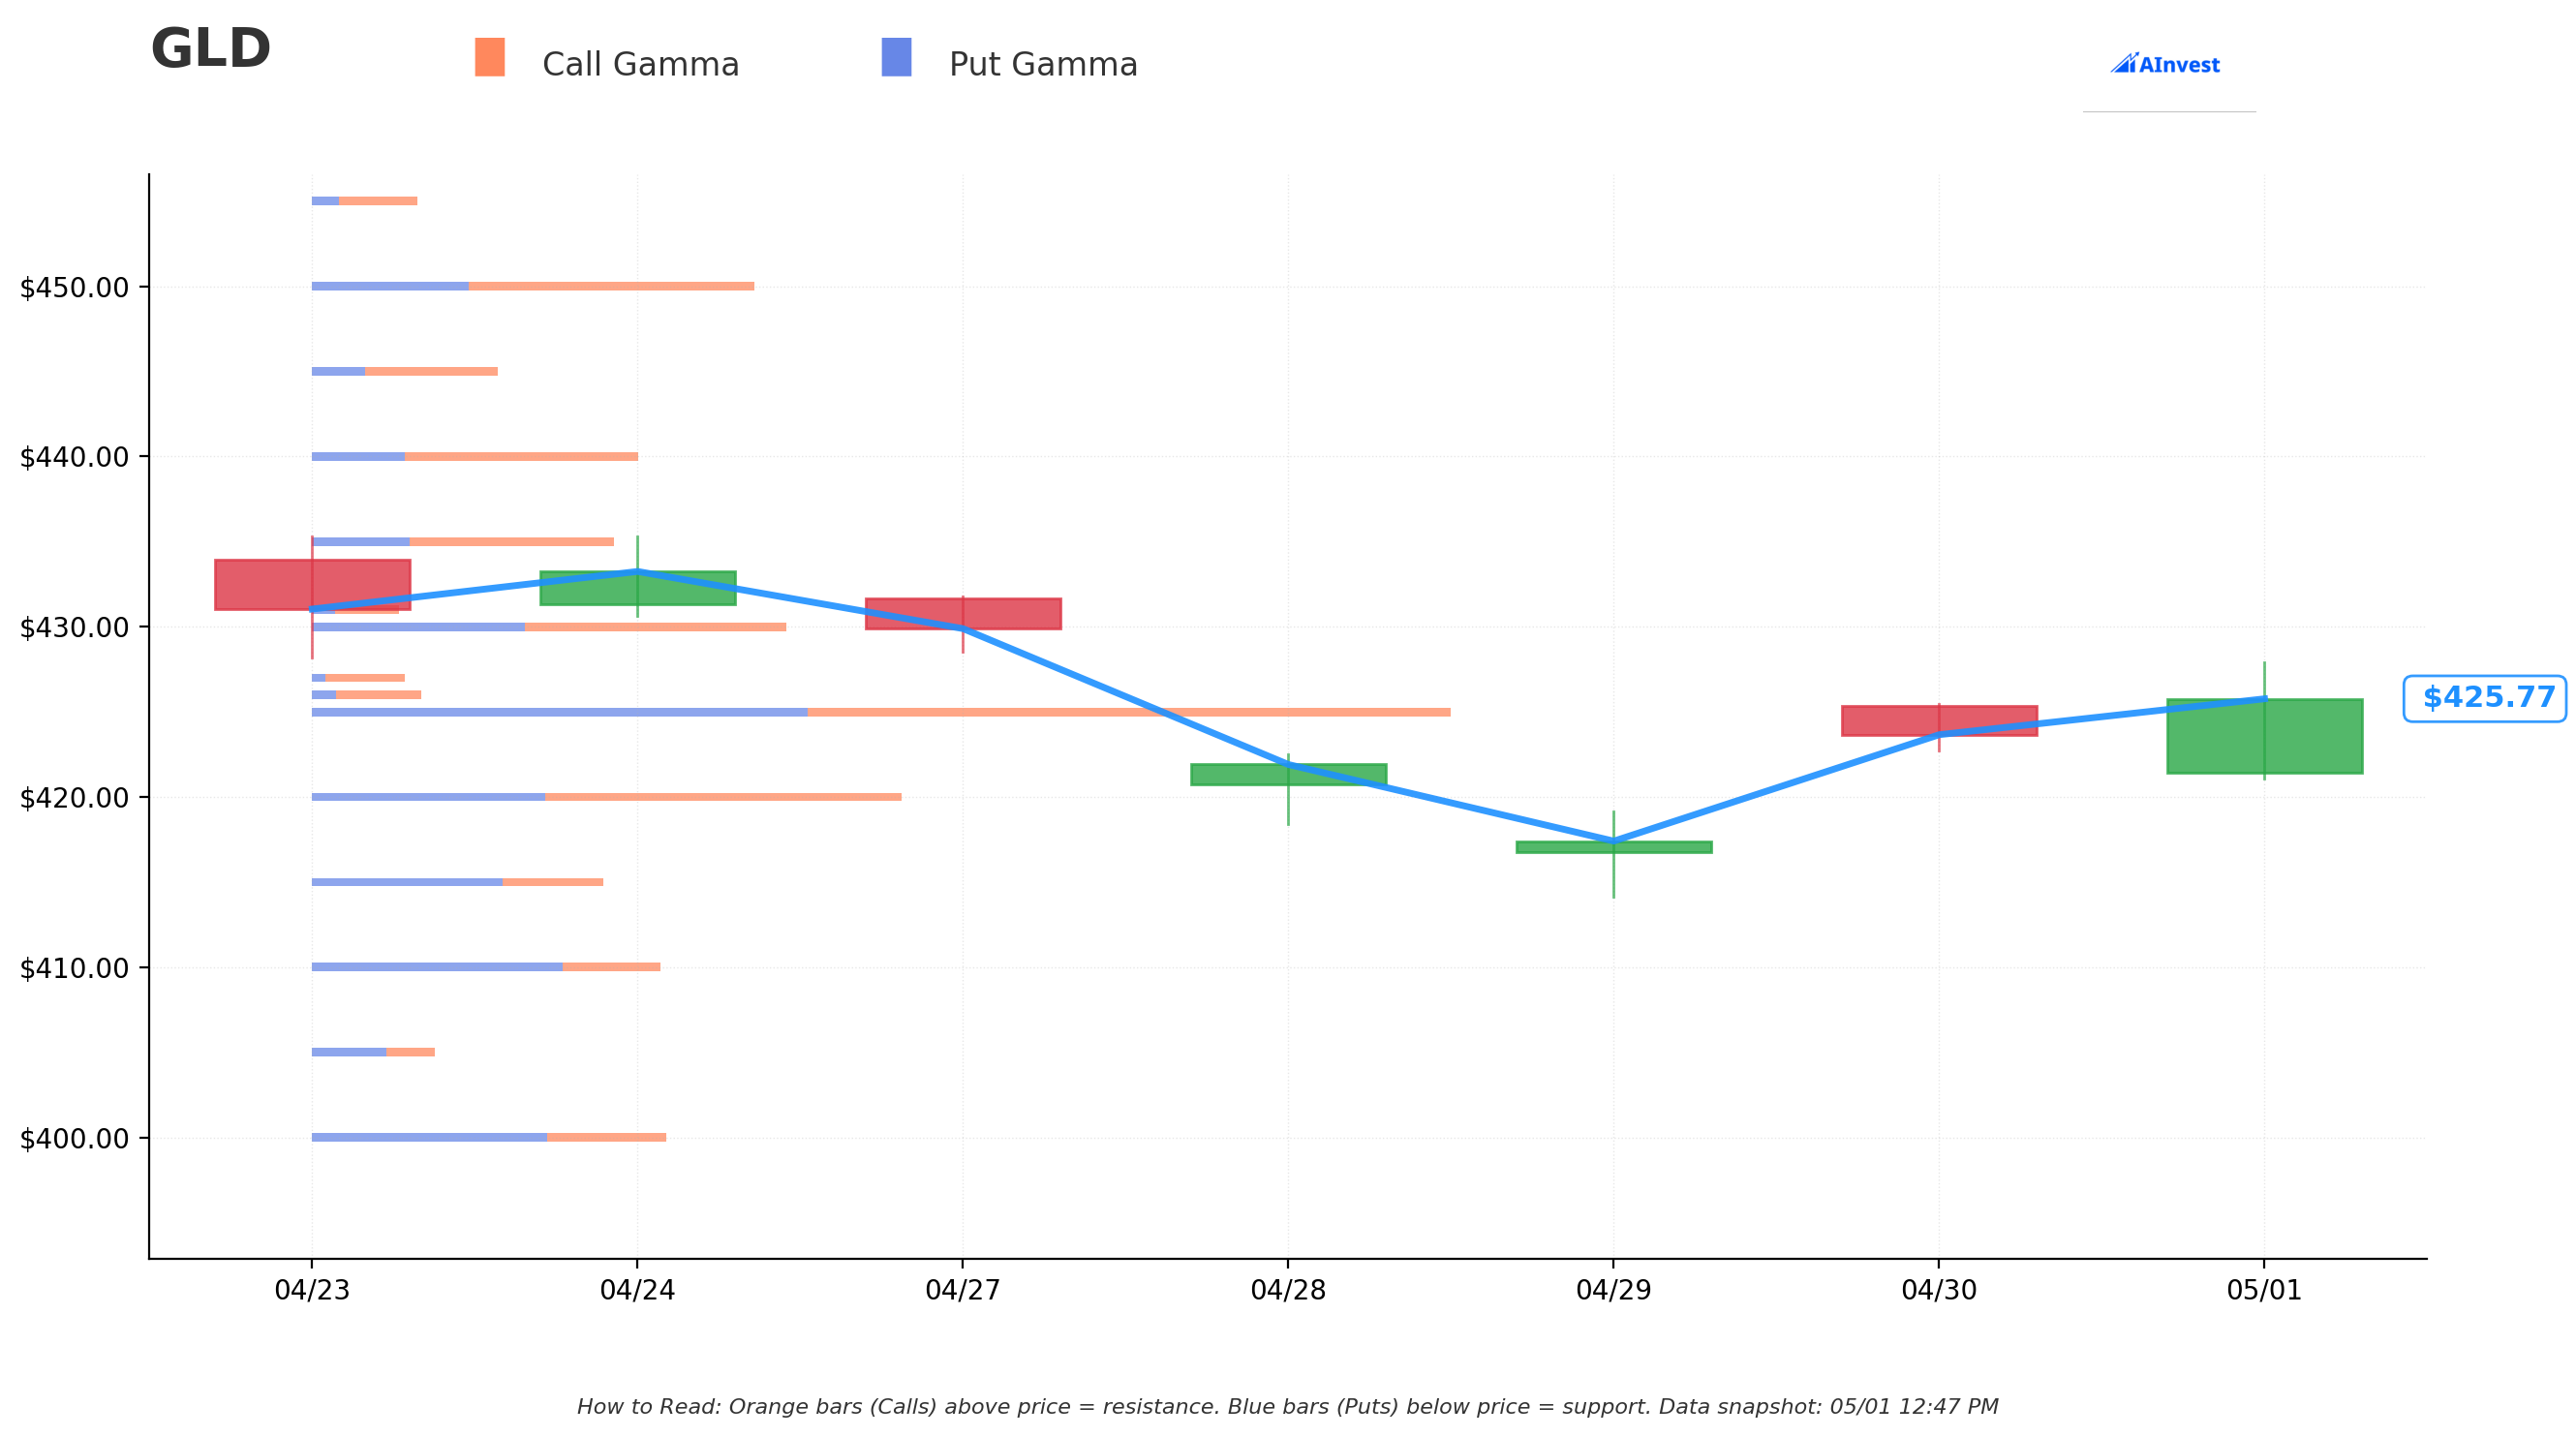
Current Price: ~$425.87 (as of GEX snapshot)
The gamma exposure map shows where market makers have large option positions that create natural price magnets and barriers:
🔵 Support Levels (Put Gamma Below Current Price):
- $425 — Immediate support, strongest nearby floor with 119.4B total gamma (68.9B call + 50.6B put). Only 0.2% below current price. This is the key short-term level to watch.
- $420 — Secondary support at 60.4B total gamma (our put trade's exact strike!). Sits 1.4% below spot. Heavy put concentration here makes sense — this is where the whale struck and where OI is building.
- $415 — Third support at 29.6B total gamma with net negative gamma (put gamma dominates). 2.6% below spot. A break of $420 likely accelerates to $415 given dealer positioning.
- $410 — Extended support at 36.1B total gamma, 3.7% below spot. Strong put gamma suggests dealer buying support here during a selloff.
- $400 — Deep structural floor at 36.6B total gamma, 6.1% below spot. This round-number strike attracts massive options positioning — a break of $400 would be a psychological and technical inflection point for gold.
🟠 Resistance Levels (Call Gamma Above Current Price):
- $430 — Immediate ceiling with 52.1B total gamma, only 1.0% above spot. This is the nearest resistance and the level GLD needs to clear convincingly to resume the uptrend.
- $435 — Secondary resistance at 31.6B total gamma, 2.1% above. Call gamma dominates here — dealers will sell rallies into this zone.
- $440 — Major resistance at 34.0B total gamma, 3.3% above spot. Multiple tests of this zone would be needed before a breakout.
- $450 — Extended resistance at 46.2B total gamma, 5.7% above. A move through $440 would likely face another strong dealer-short-call headwind at $450.
- $500 — Long-range resistance at 22.6B total gamma, 17.4% above spot. This is where institutional call selling is concentrated at the outer edge.
Net GEX Bias: Bullish (563B call gamma vs 372B put gamma overall) — But critically, the near-term picture shows heavy put concentration right at the $420 strike where our whale just loaded up. The overall bullish net GEX reflects longer-dated call positioning, while the put trade targets a specific 6.5-month window.
What this means for traders: GLD is sandwiched between $425 support and $430 resistance — a very tight range. The $425 gamma wall is the line in the sand for short-term bulls. If that cracks, $420 (the put trade's strike) becomes the next test, and the gamma map shows it's a meaningful but not impenetrable level at 60.4B. Our whale clearly believes $420 is a way station, not a floor.
Implied Move Analysis
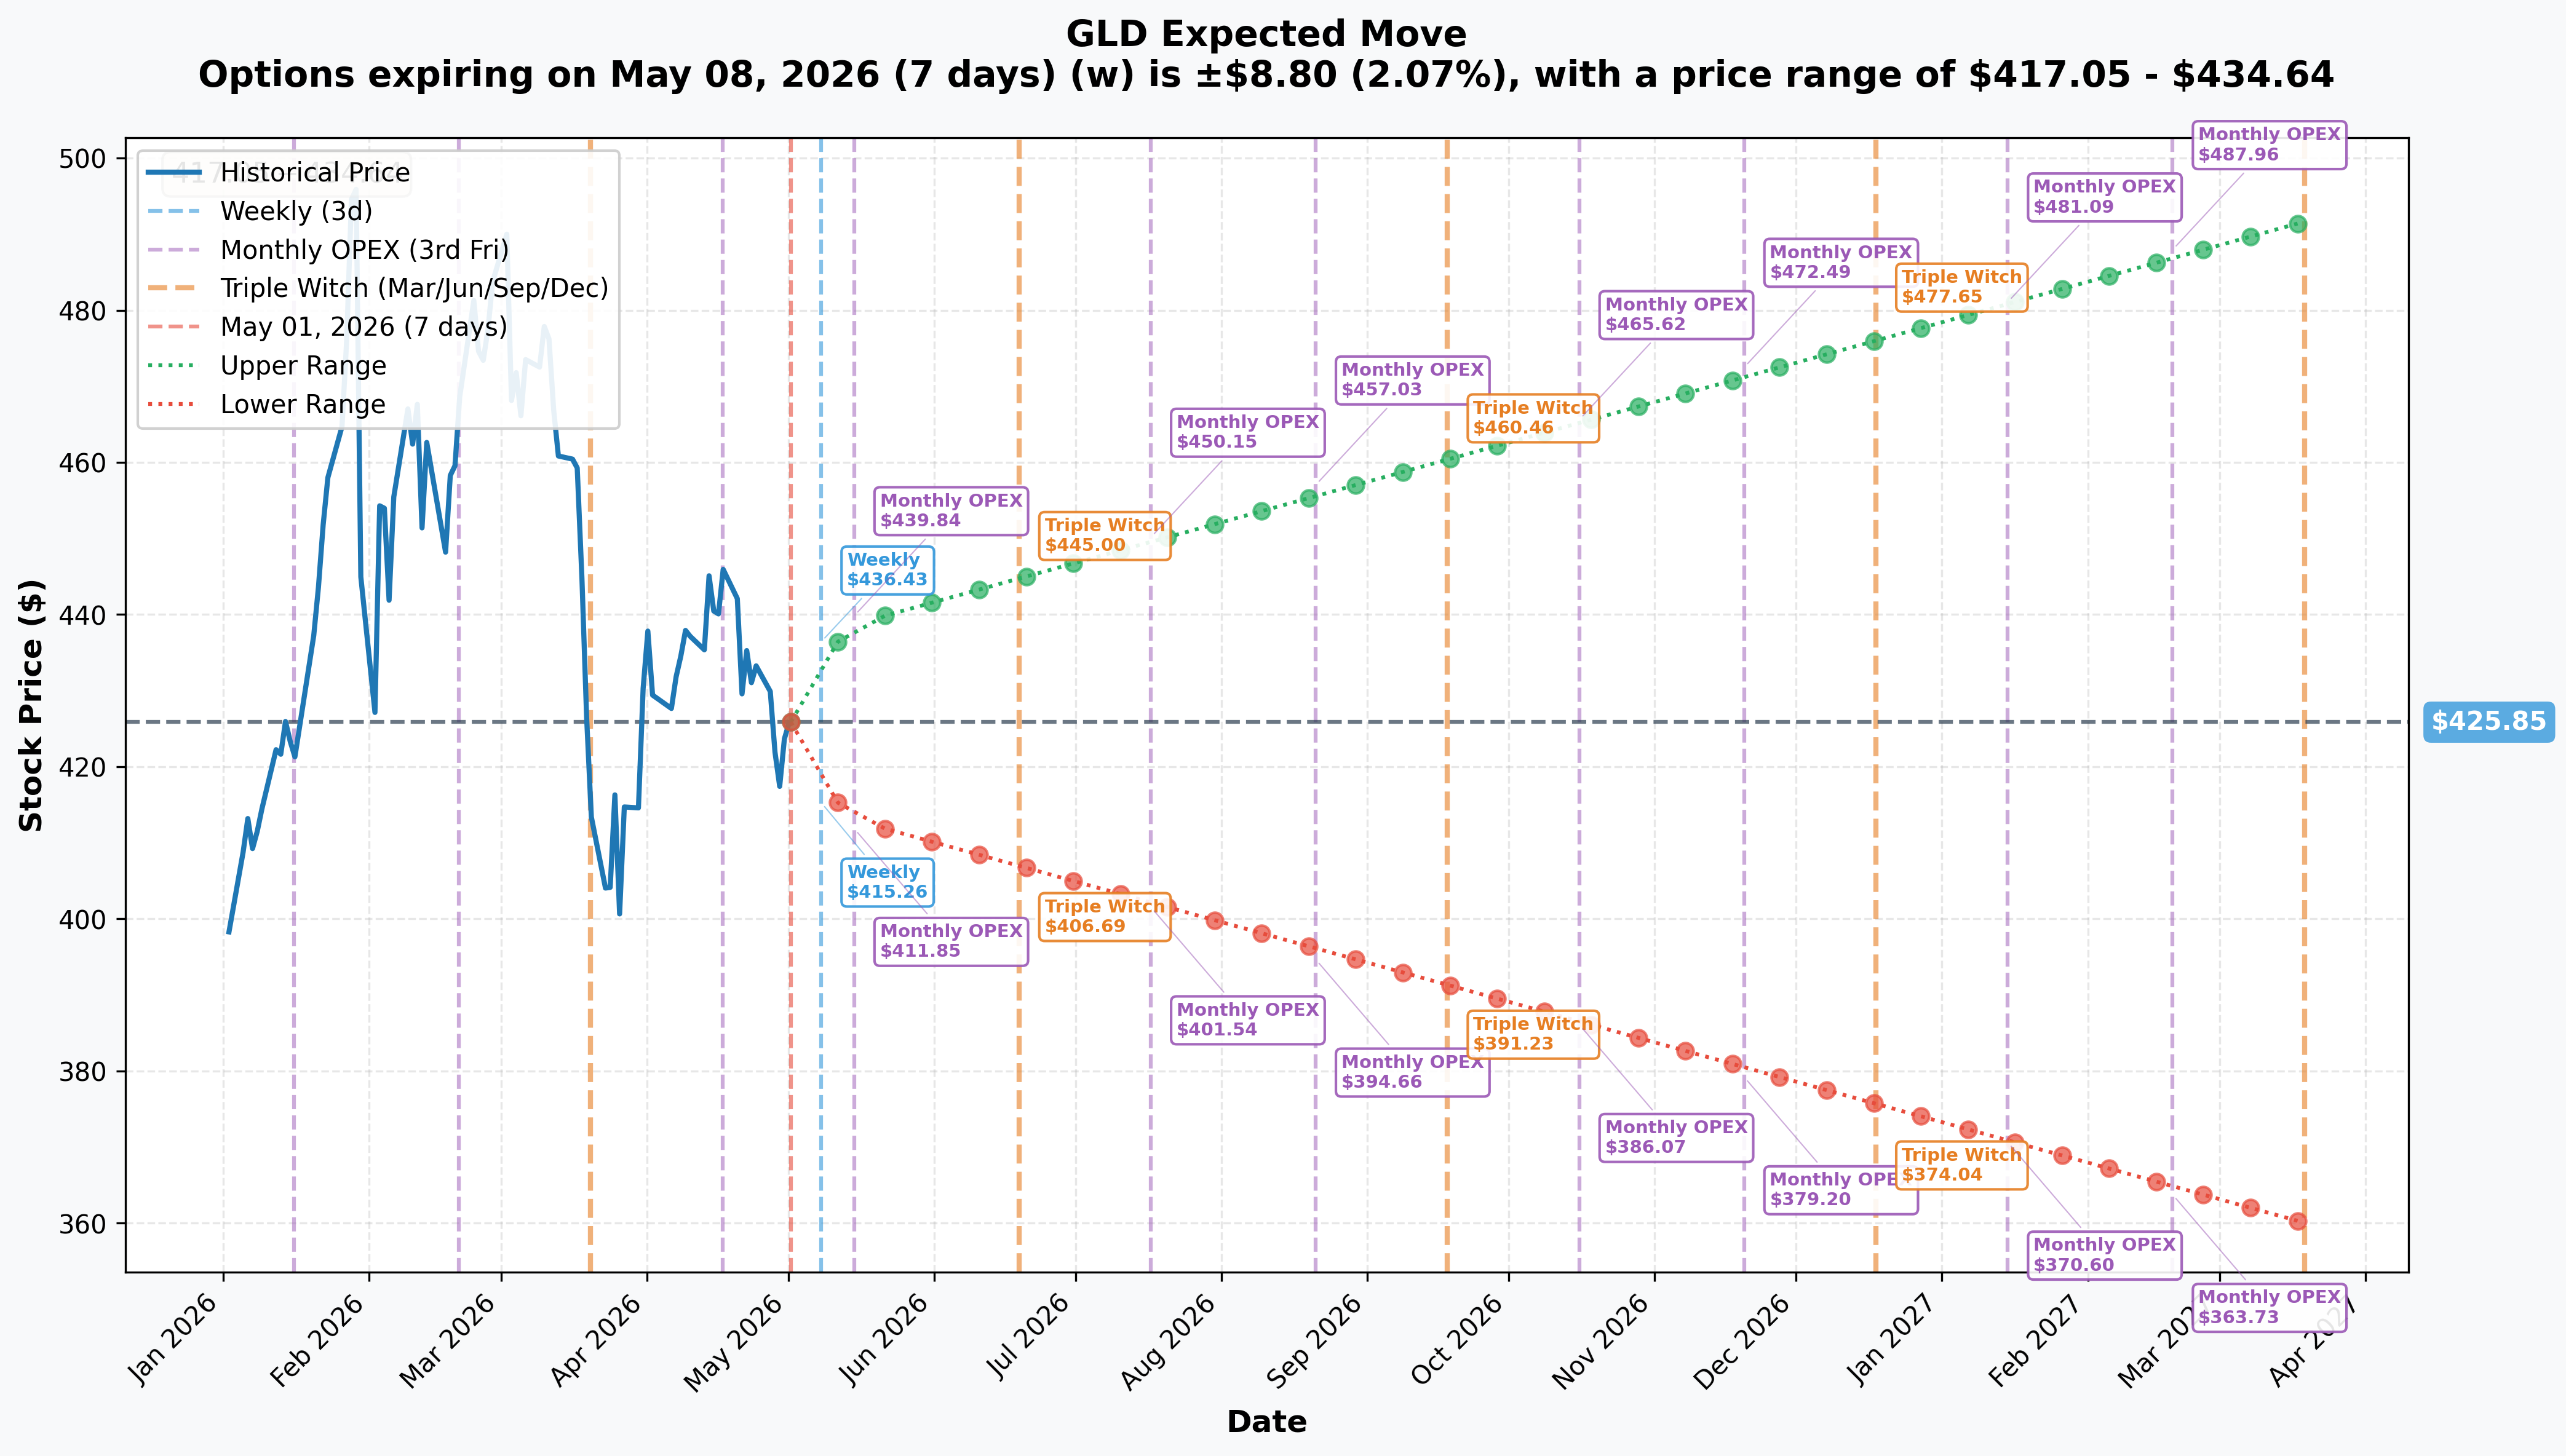
Options market pricing for upcoming expirations (from current $425.85 base):
| Expiration | Date | Days | Implied Move | Range |
|---|---|---|---|---|
| 📅 Weekly | May 8, 2026 | 7 | ±$8.80 (±2.07%) | $417.05 – $434.64 |
| 📅 Monthly OPEX | May 15, 2026 | 14 | ±$12.96 (±3.04%) | $412.88 – $438.81 |
| 📅 June Triple Witch | June 19, 2026 | ~49 | — | $406.69 – $445.00 |
| 📅 July OPEX | July 17, 2026 | ~77 | — | $401.54 – $450.15 |
| 📅 November OPEX | Nov 20, 2026 | ~203 | — | $379.20 – $472.49 |
| 📅 LEAPS | Mar 19, 2027 | 322 | ±$65.90 (±15.47%) | $359.95 – $491.74 |
Translation for regular traders:
Options are pricing in a 2.1% move ($8.80) by May 8 — relatively calm for the near-term. But zoom out to the November 20 expiry where this whale's put sits: the implied range stretches all the way down to $379.20 on the downside and up to $472.49. That $379 lower bound tells you the market already acknowledges there's real downside risk — and the put buyer is positioned just above it at the $420 breakeven (~$396 breakeven).
The key observation: the November implied range lower bound ($379) is actually BELOW the put's breakeven of ~$396. This means the options market itself is pricing in scenarios where GLD could trade at levels that make this put highly profitable. The whale isn't betting on a black swan — they're betting on the tail of what the options market already considers a plausible scenario.
Mark your calendar for June 19 (Triple Witch): This is the first major OPEX after the critical June 16-17 FOMC meeting. Options market prices a range of $406.69 to $445.00 through that date — a $38 swing. If the June FOMC is hawkish (signals fewer rate cuts), the lower end of that range comes into play fast.
🎪 Catalysts
🔥 Past Catalysts (Already Happened)
ATH in January 2026 — Gold's Historic Peak 🏆
Spot gold reached an all-time high of approximately $5,595/oz on January 29, 2026, driven by a perfect storm of geopolitical risk, central bank buying, and DXY weakness. GLD tracked this move to its own all-time high. This peak is the reference point for the current -15% correction and the backdrop for today's bearish put trade.
April 28-29, 2026 FOMC — Rates Held at 3.50%-3.75% ✅
The Fed held the federal funds target range steady at 3.50%-3.75% for a second consecutive meeting, per the official Federal Reserve statement. The "patient" language provided temporary relief and powered the April 30 gold rally. However, the hold also confirmed the Fed is NOT cutting yet — keeping 10-year TIPS real yields near 1.94%, which remains the primary headwind for gold.
DXY 4-Year Low — April 21, 2026 📉
The Dollar Index printed 98.14 on April 21, 2026 — its lowest reading since March 2022 — per AhaSignals DXY tracker. A weak dollar is normally rocket fuel for dollar-denominated gold. Yet gold has STILL corrected -15% from the January high despite this tailwind. The put buyer may be noting this divergence as a warning sign — if the DXY reverses from extreme bearish positioning, gold could face additional headwinds.
March 2026 — Record ETF Outflows 💸
North America posted $13B in gold ETF outflows in March 2026, ending a 9-month inflow streak — per the World Gold Council. This was the largest monthly outflow since September 2022. Western institutional investors were the marginal sellers even as Eastern (central bank and retail) demand remained robust. This structural split in demand is a key risk for GLD specifically, since GLD's AUM reflects primarily Western investment flows.
Q1 2026 Demand — Record $193B But With a Catch 📊
The World Gold Council Q1 2026 Gold Demand Trends report confirmed total Q1 gold demand of 1,231 tonnes (+2% YoY) but the real headline was demand value jumping 74% YoY to a record $193 billion — mostly a price effect from gold's elevated average price, not a volume surge. Central bank buying remained "reassuringly robust" with Poland leading at >20 tonnes YTD and Malaysia and South Korea resuming purchases after extended absences.
April 2026 — IMF Tariff Warning 🌍
The IMF April 2026 World Economic Outlook flagged trade uncertainty at "unprecedented levels" following renewed U.S. tariff threats against China and the EU. This geopolitical risk premium (estimated at 8-12% of gold's current price, or $400-$600/oz per major bank analysts) is a double-edged sword: it supports gold while the risk is present, but could unwind quickly on any de-escalation news.
🚀 Upcoming Catalysts (Next 6 Months — Critical)
June 16-17, 2026 FOMC — The Make-or-Break Event 🎯
This is THE catalyst that will either vindicate or destroy the put trade. The June FOMC includes the Summary of Economic Projections (SEP) and the dot plot — meaning markets will get a fresh read on how many rate cuts the Fed sees in 2026 and beyond. There is no May 2026 FOMC meeting (next after April 28-29 is June), per the Federal Reserve FOMC Calendar.
- 🐻 Hawkish scenario (put buyer's dream): Fed signals fewer cuts than priced, dot plot shifts higher, real yields stay elevated, Western ETF outflows accelerate. GLD could gap toward $400 support.
- 🐂 Dovish scenario (put buyer's nightmare): Fed signals multiple 2026 cuts, real yields compress, Western ETF inflows return in force. GLD could break above $430-$440 resistance and the put decays sharply.
With 6.5 months to the November 20 expiry, the put buyer has two shots at this scenario — June 16-17 AND the July 28-29 FOMC.
May/June 2026 CPI and PCE Prints 📊
Every inflation data release is now a binary event for gold. Higher-than-expected inflation = stagflation fears = gold-friendly. Lower inflation = Fed can cut = initially gold-friendly but then real-yield driven. The asymmetry is complex but the put buyer is betting the net effect of upcoming data is bearish for gold over the next 6 months.
Jackson Hole Economic Symposium — Late August 2026 🏔️
Powell's keynote at Jackson Hole has historically been a major gold catalyst. If the Fed signals a shift in either direction, expect a large GLD move. This event falls well within the November 20 expiry window.
September 15-16, 2026 FOMC (SEP Meeting) 📅
The September FOMC is another SEP/dot-plot meeting — a second potential major dovish/hawkish pivot moment before the November 20 expiry. Gives the put trade a third major catalytic event.
Continued Central Bank Disclosures 🏦
WGC forecasts ~850 tonnes of central bank buying in 2026, near-flat vs. 2025. Any single quarter shortfall — particularly from China, which has paused and resumed buying unpredictably — would rattle the bull thesis. Monthly IMF International Financial Statistics updates will be watched closely. A China pause announcement could be a sharp short-term catalyst for the put trade.
U.S.-China Tariff Escalation/De-escalation 🌐
Any tariff implementation, pause, or rollback between now and November is a direct gold catalyst. The current IMF-flagged "unprecedented" tariff uncertainty is partly priced into gold's geopolitical premium. De-escalation = premium compression = GLD lower. The put buyer may be banking on some version of this.
U.S. Fiscal and Debt Ceiling Dynamics 💵
Persistent U.S. deficit concerns and any debt ceiling debates in the second half of 2026 would typically support gold's de-dollarization narrative. However, if fiscal tightening forces a shift in Fed policy expectations, the net effect on gold could be negative. This is a lower-probability but high-magnitude catalyst.
🎲 Price Targets & Probabilities
Using gamma levels, implied move data, and the catalyst calendar through November 20, 2026:
📈 Bull Case for GLD (25% probability) — Put Buyer Loses
Target: $445-$472
How we get there:
- 🐂 June 17 FOMC delivers dovish dot plot, signaling 3+ cuts in 2026 — Western ETF inflows surge back
- 📈 DXY remains near 4-year lows at 98, gold resumes USD-weakness-driven rally
- 🏦 Central bank buying surprises to the upside — China resumes purchases after pause
- 🌍 Geopolitical risk remains elevated through November (Ukraine, Middle East, tariff tensions)
- 📊 JPMorgan's $6,300 year-end target and Goldman's $5,400 both pull GLD toward $450+
- 🚀 GLD breaks above $430 resistance → $435 → $440 resistance cascade; implied move upper bound for November is $472.49
What the put buyer faces: Put decays toward zero, $7.8M loss. Painful but capped.
🎯 Base Case (45% probability) — Grinding Consolidation
Target: $400-$430 range
Most likely scenario:
- ✅ Fed stays on hold through mid-2026 — neither hawkish nor dovish catalyst materializes cleanly
- 📊 Gold grinds sideways in the $4,400-$4,700/oz spot range, tracking GLD $400-$430
- 🔄 Western ETF outflows continue at a moderate pace, offset by Eastern central bank demand
- ⚖️ TIPS real yields near 1.94% continue to cap upside without triggering a crash
- 🎢 Volatility remains elevated (Jackson Hole, FOMC) but no decisive directional break
- 📉 GLD oscillates between $425 gamma support and $430 resistance for weeks before a clearer trend emerges
- 💤 The put loses significant time value as theta erodes premium in a sideways market
Put P&L in Base Case: Premium decays meaningfully but not fully. The put might be worth $10-15 at expiry if GLD is at $410-420, representing a partial recovery. At $425-430, the put is likely worth less than $5 and the position represents a significant loss.
📉 Bear Case (30% probability) — Put Buyer Wins Big
Target: $379-$420
What sends GLD lower:
- 😰 June 17 FOMC dot plot signals fewer cuts — market reprices higher for longer, real yields spike
- 🇸 CFTC speculative dollar short at extreme positioning (18th percentile bearish) — a violent DXY short squeeze would crush gold
- 🕊️ Ukraine ceasefire or Middle East de-escalation compresses the 8-12% geopolitical premium ($400-$600/oz) rapidly
- 🏦 China pauses central bank gold purchases — removes the major structural bid and rattles confidence
- 📉 North America ETF outflows continue or accelerate from March's $13B record pace
- 💸 Sentiment reversal — the "sell gold, buy equities" rotation resumes as risk-on returns
- 📊 GLD breaks $425 → $420 strike (put goes in-the-money) → technical acceleration toward $415, $410, $400
Put P&L in Bear Case:
- GLD at $410 at Nov 20: Puts worth
$10, partial recovery ($3.4M value from $7.8M cost) - GLD at $400 at Nov 20: Puts worth
$20, breakeven territory ($6.6M value) - GLD at $390 at Nov 20: Puts worth
$30, meaningful profit ($9.9M value, ~$2.1M gain) - GLD at $370 at Nov 20: Puts worth
$50, big win ($16.6M value, ~$8.8M gain on $7.8M invested)
The implied move lower bound for November ($379.20) would put these puts well in-the-money and represent a >100% return on the $7.8M premium.
💡 Trading Ideas
🛡️ Conservative: Track the Level — Buy GLD Stock on a Dip to $415-420
Play: Don't fight the whale directly — let the put activity tell you where smart money sees a buying opportunity at lower levels. If GLD pulls back to the $415-420 zone (where both the put strike and strong gamma support sit), consider initiating or adding to a GLD long stock position.
Why this works:
- 🎯 The $420 strike carries 60.4B total gamma — market makers will defend this level with mechanical buying. If GLD dips to $420, dealer gamma hedging creates a natural cushion.
- 💰 Spot gold's Q1 2026 record $193B demand value and central bank accumulation by Poland, Malaysia, South Korea provide fundamental support
- 📊 At $415-420, you're buying at levels the market is already pricing as fair — not chasing highs
- 🏦 JPMorgan's $6,300 year-end target and Goldman's $5,400 suggest significant upside if the bull thesis holds
- ⏰ No options complexity — buy GLD stock and hold. Sleep well.
- 🛡️ Set a stop-loss below $400 (the next major gamma support zone), limiting downside to roughly 5% from entry
Action plan:
- 👀 Watch for GLD to test $420 on any macro weakness or post-FOMC pullback
- 🎯 Initiate position in the $415-420 range; scale in rather than buying all at once
- 📅 Mark June 17 FOMC as a key inflection — be prepared to reassess if the dot plot is hawkish
- ✅ Hold through Jackson Hole (late August) and September FOMC for the next catalytic impulse
- 🎯 Target: $440-$450 resistance zone (8-10% upside from entry)
Risk level: Low-Moderate | Skill level: Beginner-friendly | Max loss: ~5% with stop at $400
⚖️ Balanced: Bull Put Spread — Collect Premium While GLD Digests
Play: Sell a put spread to collect premium while betting GLD holds above $400 through May OPEX. This lets you be on the OTHER side of put buying — collecting the premium that traders are overpaying for protection.
Structure: Sell the GLD $420 put / Buy the GLD $410 put, both expiring May 15, 2026 (14 days)
Why this works:
- 💰 With put demand elevated (evidenced by today's $7.8M whale print), put implied volatility is elevated — meaning you collect MORE premium as the seller
- 📊 The $420-$410 zone has 60.4B + 36.1B total gamma — strong structural support making a fast breakdown through both levels unlikely in just 14 days
- 🎯 The implied move for May 15 OPEX is only ±$12.96 (±3.04%), putting the lower range at $412.88 — ABOVE both strikes in this spread
- ⏰ 14 days is short enough that time decay (theta) works rapidly in the spread seller's favor
- 🛡️ Defined risk — the maximum you can lose is the spread width ($10) minus the premium collected
Estimated P&L:
- 💸 Premium collected: approximately $2.50-3.50 net credit per spread (adjust at time of entry)
- 🏆 Max profit: $250-350 per spread if GLD closes above $420 on May 15 (collect full credit)
- 📉 Max loss: $650-750 per spread if GLD closes below $410 on May 15 (spread width minus credit)
- 🎯 Breakeven: approximately $416.50-$417.50 (the $420 strike minus net credit)
- 📊 Risk/Reward: ~2:1 risk-to-reward, but probability of profit is roughly 70% given the implied move
Entry timing:
- ✅ Enter immediately or within the next 1-2 days while put IV is elevated from today's whale activity
- ❌ Skip if GLD drops below $422 before entry (spread gets too close to at-the-money to be worth the risk)
- 📅 Close for 50% of max profit rather than holding to expiry — don't get greedy
Position sizing: Limit to 2-3% of portfolio on this defined-risk spread. This is income generation, not speculation.
Risk level: Moderate | Skill level: Intermediate | Required: Understanding of spread mechanics and defined-risk options
🚀 Aggressive: Mirror the Whale — Long Put or Put Spread to November (DIRECTIONAL BEARISH)
Play: For traders who share the put buyer's macro view — that gold's correction has further to run — consider a scaled-down version of the whale's position or a put spread to define your max risk.
Option A — Straight Long Put (mirrors the whale):
- Buy 1-5 GLD $420 puts expiring November 20, 2026 (same as the whale)
- Current estimated cost: approximately $23-25 per contract ($2,300-$2,500 per contract)
- Breakeven: ~$395-397 at expiration
Option B — Put Spread (defined risk, cheaper):
- Buy GLD $420 put / Sell GLD $400 put, both November 20, 2026
- Estimated net debit: approximately $8-11 per spread ($800-$1,100 per spread, depending on IV)
- Max profit: ~$9-12 per spread if GLD below $400 at Nov 20 expiry
- Breakeven: approximately $409-$412
Why Option B is smarter for retail:
- 🛡️ Defined risk — you know the maximum loss upfront (the net debit paid)
- 💰 The short $400 put helps finance the long $420 put — you pay roughly 50-60% less than owning the put outright
- 📊 Your max profit zone ($400 and below) aligns perfectly with the November implied lower bound ($379.20) — the market already sees this scenario as plausible
- 🎯 You capture the full put spread payout if GLD breaches $400, which the gamma map shows as the next major support after $415 and $410
Why this could be a disaster:
- 💸 If GLD is above $420 on November 20, Option A loses the full $23-25/contract
- 📈 The overall net GEX is bullish (563B call vs 372B put gamma) — the structural options market positioning still leans up, not down
- 🏦 Three central banks just resumed buying (WGC data) — that's a powerful floor for gold
- 📊 JPMorgan targets $6,300 and Goldman targets $5,400 — fading both of those is a contrarian call
- 🔑 You need TWO things to go right: gold must fall AND it must happen before November 20
Key levels to watch (CRITICAL):
- 📉 Below $425: Short-term bearish signal — watch for gamma support to fail
- 📉 Below $420 (put goes ITM): Momentum accelerates, theta risk diminishes as the put goes in-the-money
- 📉 Below $410 → $400: If Option B spread, approaching max profit zone
- 📈 Above $435-$440: Consider cutting the position — bullish technical breakout invalidates the thesis
Catalyst triggers for this trade:
- 📅 June 17 FOMC — Most important. A hawkish dot plot is the clearest catalyst for the bear case.
- 📅 Jackson Hole (late August) — Any hawkish Fed signals here would powerfully support the put trade.
- 🌍 Ukraine or Middle East de-escalation news — Compresses the geopolitical premium fast.
- 🏦 China central bank pause announcement — Removes the structural bid narrative.
Risk level: HIGH (can lose 100% of premium in Option A) | Skill level: Advanced | Max loss: Full debit paid
⚠️ Risk Factors
The put buyer may be wrong — here is why:
-
🏦 Central bank buying remains a structural floor: WGC forecasts ~850 tonnes of central bank buying in 2026, similar to 2025's record pace. Poland alone has a multi-year plan to reach 700 tonnes — that's steady, price-insensitive buying that doesn't go away on a bad FOMC print. Central bank demand is the new "Fed put" for gold.
-
💵 DXY at 4-year lows creates a powerful tailwind: With the Dollar Index at 98.14 — a level not seen since March 2022 — gold's most reliable tailwind is firmly in place. Historically, DXY near multi-year lows has been associated with gold multi-year breakouts, not corrections. The put buyer is fighting this tailwind.
-
📊 Bank price targets are heavily bullish: JPMorgan targets $6,300, Goldman $5,400, BofA and Wells Fargo $6,000-$6,100 — these are year-end 2026 targets from major banks who have conviction on gold. At current spot near $4,650, reaching these targets would send GLD well above $500, making the $420 put worthless.
-
🌍 Geopolitical risk premia remain sticky: Active conflicts in Ukraine and the Middle East, ongoing U.S.-China trade tensions, and the broader de-dollarization narrative by emerging market central banks create persistent safe-haven demand. A credible resolution in ANY of these conflicts is needed to compress the geopolitical premium meaningfully.
-
📈 GEX overall is bullish: The gamma exposure data shows 563B in call gamma vs 372B in put gamma — overall market maker positioning leans bullish, and the structural position of the options market creates a gamma tailwind (dealers buy GLD as it rises, creating momentum effects).
-
⏰ 6.5 months is a long time for theta to erode the position: The put buyer is paying significant time value. Every week GLD stays above $420, the premium decays. At ~$23-25/contract cost and 203 days to expiry, theta erosion is a slow but steady drain. The put needs GLD to move — sideways is the enemy.
-
💸 Real yields as a headwind can reverse quickly: 10-year TIPS at 1.94% are elevated, but they can compress fast on any dovish Fed signal. A single dovish surprise at the June FOMC could see real yields fall 20-30bp overnight, re-pricing gold significantly higher and crushing the put.
-
🔄 This could be a hedge, not a pure bet: Given the $7.8M scale (equivalent to hedging ~$141M in GLD shares), this may be a portfolio hedge by a fund that is long gold or gold miners and wants downside protection through the June FOMC binary. If that's the case, the "put buyer" may not actually want gold to fall — they just want the insurance. Don't automatically assume the whale is outright bearish.
-
🐻 But the bearish scenario is real: Some analysts see crash risk to $3,400/oz spot if real yields remain elevated and central bank demand normalizes. March's $13B North America ETF outflow — the largest since September 2022 — shows Western investors are already reducing gold exposure. If this trend accelerates, GLD faces structural outflow pressure.
🎯 The Bottom Line
Here's the deal: Someone dropped $7.8 million in 25 seconds betting gold fades through November. This is either a sophisticated macro hedge protecting a massive long gold position — or a high-conviction directional call that the -15% correction from January's $5,595/oz ATH has more room to run.
What the trade tells us:
- 🎯 The whale struck at $420 — exactly 2% out-of-the-money — requiring GLD to fall another ~$8 just to reach the strike. Breakeven is $396, roughly 7% below current levels. This isn't a knife-catching put; it's a patient, medium-term macro call.
- ⏰ The November 20 expiry was chosen deliberately to capture the June 16-17 FOMC, Jackson Hole, AND the September 15-16 FOMC — three of the most important monetary policy events of the year. That's not an accident.
- 💰 Paying $7.8M for protection through November signals this entity is worried about a risk it can't afford to ignore — either because their gold long is enormous, or because their macro analysis says the June FOMC is a real threat to the gold bull thesis.
- 📊 The Z-scores of 8.82 and 16.38 on back-to-back legs confirm this is among the most unusual GLD options activity seen in recent memory. This happens a handful of times a year, not every week.
If you're bullish on gold (base-case scenario):
- ✅ Don't panic-sell your GLD because one whale bought puts. The net GEX is still bullish, bank targets are still $5,400-$6,300 spot, and central bank buying is structural.
- 📊 Use the $420 gamma support level as your line in the sand — it's a natural floor given dealer positioning and now has additional put open interest from today's trade
- 🎯 Consider trimming a small portion at current levels and rebuilding if GLD pulls back to $415-420 — let the gamma support do its job
- 📅 Mark June 17, 2026 on your calendar — that FOMC is the single most important near-term catalyst for your position
If you're neutral or want to play the volatility:
- ⚖️ The bull put spread strategy (sell $420/$410 put spread for May OPEX) takes advantage of elevated put IV while the implied move suggests GLD likely stays above $412 through May 15
- 💰 Collecting 2-3 weeks of premium while gamma support sits at $420 is a reasonable risk/reward for sophisticated traders who understand the defined-risk structure
If you're bearish on gold:
- 🐻 The whale is your confirmation. Scale into put spreads or straight puts only with capital you can afford to lose entirely.
- 🎯 Watch for GLD to crack $425 (the nearest gamma support) — that's the first technical trigger
- 📉 A break below $420 flips the script — the put goes in-the-money and momentum could accelerate toward $415, then $410
- 📅 Your alpha catalysts are the June 17 FOMC dot plot and any geopolitical de-escalation headline — those are the two events most likely to compress gold's premium quickly
Key calendar dates to track:
- 📅 May 8, 2026 — Weekly OPEX (implied ±$8.80 move)
- 📅 May 15, 2026 — Monthly OPEX (implied ±$12.96 move, $412.88 lower range)
- 📅 June 16-17, 2026 — FOMC meeting with dot plot — THE key catalyst
- 📅 June 19, 2026 — June Triple Witch OPEX ($406.69 lower implied range)
- 📅 Late August 2026 — Jackson Hole Economic Symposium
- 📅 September 15-16, 2026 — FOMC with SEP/dot plot
- 📅 November 20, 2026 — This put expires. Decision day.
Final verdict: The bull case for gold remains structurally sound — DXY weakness, central bank accumulation, and major bank targets all support higher prices. But the -15% correction from the January ATH, record Western ETF outflows in March, and elevated real yields tell you this isn't a one-way trade. The whale that just deployed $7.8M through November isn't stupid — they're positioning for a scenario where the gold story gets complicated on June 17. Respect that signal, manage your risk accordingly, and don't bet more than you can afford to lose. Gold has humbled traders in both directions this year. 💪
Disclaimer: Options trading involves substantial risk of loss and is not suitable for all investors. This analysis is for educational purposes only and does not constitute financial advice. Past performance does not guarantee future results. The unusual activity described (Z-scores of 8.82 and 16.38) reflects the size of these specific trades relative to recent GLD options history — it does not imply the trades will be profitable or that you should replicate them. The put buyer may have complex hedging needs not applicable to retail traders. All price targets are probabilistic estimates, not guarantees. Breakeven calculations assume positions held to expiry without adjustments. Always do your own research, understand the products you trade, and consider consulting a licensed financial advisor before making investment decisions. GLD as a collectible ETF may be subject to a 28% long-term capital gains tax rate for U.S. holders — consult a tax professional for your specific situation.
About SPDR Gold Shares (GLD): The world's largest physically-backed gold ETF with ~$155.11 billion in AUM and 1,039.20 tonnes of allocated gold bars held in HSBC's London vaults. Listed on NYSE Arca, GLD represents approximately 25% of global gold ETF assets and serves as the primary institutional vehicle for spot gold exposure in the United States. Expense ratio: 0.40%. Sponsor: State Street Global Advisors / World Gold Trust Services.