🤝 GLD $35M Deep-ITM Put Block Cross — Resolved: A Hedge Being CLOSED, Not a Fresh Bear Bet
🔄 Updated 2026-06-12: Next-day OPRA OI resolved this to the close side — open interest fell 44,132 → 31,970 (Δ −12,162 ≈ the 12,592 traded). The deep-ITM put block unwound an existing protective position; it was not new bearish positioning on gold.
📅 June 11, 2026 | 🔥 Unusual Activity Detected
🎯 The Quick Take
A desk crossed a negotiated $35M block of deep in-the-money puts on GLD — the world's largest gold ETF — with the strike sitting ≈$25 above where GLD was trading at print time. The trade was flagged provisional on June 11 because size (12,592) was smaller than prior OI (44,000). Next-day OPRA OI has now resolved it: open interest fell by ≈12,162, almost exactly matching the trade size — this was a CLOSE of an existing protective put position, not a fresh bearish bet. A desk that had been long the $400 puts — bought when GLD was near or above $400 — took the position off and collected the proceeds. The $35M headline was capital flowing out of a hedge, not into a new short.
📊 Fund Overview
SPDR Gold Shares (GLD) is the oldest and largest U.S. physically-backed gold ETF, launched in 2004. Each share represents a fractional allocated claim on real gold bullion held in secured London vaults — not futures, not miners, not a derivative. Actual metal. (ETF Database)
- AUM: ≈$100B+, the largest gold ETF by a wide margin
- Expense Ratio: 0.40% per year
- Sector: Physically-held precious metals (commodity)
- What it tracks: Spot gold, nearly tick-for-tick. An option on GLD is functionally a bet on the gold price itself
- GLD share price at trade time: $374.82
Because each GLD share represents roughly 1/10th of a troy ounce, the share price (≈$374–$382 range today) is approximately one-tenth of the spot gold price. All option mechanics — strike, premium, breakevens — in this article use GLD share-price terms.
💰 The Option Flow Breakdown
📊 The Tape — June 11, 2026
| Time | Buy/Sell | Type | Expiration | Premium | Strike | Volume | OI | Size | Spot | Option Price | Option Symbol |
|---|---|---|---|---|---|---|---|---|---|---|---|
| 11:20:23 | BUY | PUT $400 | 2026-07-17 | $35M | $400 | 13,000 | 44,000 | 12,592 | $374.82 | $28.16 | GLD20260717P400 |
Flow type: 🤝 BLOCK CROSS — a pre-arranged, negotiated block where a desk matched a buyer and seller off the open book. This is NOT an aggressive lit sweep, NOT a market order consuming displayed liquidity. A known counterparty took the opposite side.
Order type: Close / hedge-unwind — OI-confirmed. Next-day OPRA OI fell 44,132 → 31,970 (Δ −12,162 ≈ 12,592 traded), confirming this was a closing of an existing long-put position, not a new open.
✅ RESOLVED — Next-Day OI Confirms a CLOSE / Hedge-Unwind (2026-06-12)
The next-day OPRA open-interest snapshot answers the question in the headline:
| Snapshot | Open Interest |
|---|---|
| Pre-print baseline (EOD 2026-06-10) | 44,132 |
| Resolving (EOD 2026-06-11) | 31,970 |
| Δ | −12,162 (≈ the 12,592 traded) |
Open interest FELL by ≈12,162, almost exactly the trade size — confirming a closing / hedge-unwind. An existing holder of deep-ITM $400 puts (a protective long) took the position off; this was not a fresh bearish bet on gold. The $35M headline was capital coming out of a hedge, not new downside conviction.
What this means in plain terms: A desk that had been carrying the $400 puts as downside protection — very likely established when GLD was trading near or above $400 — used the June 11 block cross to exit that protection and collect the proceeds. With gold already down ≈13% on the month, those puts had accumulated substantial gains. This is textbook risk-management profit-taking: exit the hedge while the hedge is working, not after the move has played out.
🤓 What This Actually Means — Plain English
Let's decode this for everyone, zero assumed knowledge.
What happened — the resolved picture: A desk that owned GLD $400 puts as downside protection — very likely bought earlier in 2026 when GLD was trading near or above $400 — exited that hedge on June 11 via a $35M block cross. With GLD now at $374.82, those puts had become deeply in-the-money and were sitting on large gains. The desk took the money off the table. This is a sell-to-close (STC) — capital flowing OUT of an existing protective position, not into a new bearish bet.
Why is the $400 put "deep in the money" when GLD is at $374.82?
A put option gives you the right to sell something at a fixed price. The $400 put gives you the right to sell GLD at $400, even if the market price falls to $300. Because GLD is currently at $374.82 — which is already below the $400 strike — the put is already worth its intrinsic value. It is ≈$25.18 in-the-money ($400 − $374.82), plus about $3 of time value = the $28.16 price you see on the tape. The seller of the close collected $28.16 per share, for 12,592 contracts × 100 shares = $35M total in proceeds.
Deep-ITM puts behave like short positions. A put this far in-the-money has a high negative delta — it moves nearly dollar-for-dollar with a decline in GLD. The original holder was effectively long a synthetic short on gold. By closing the position, they exited that short exposure and locked in the gains accumulated since GLD fell from the $400+ range.
Very little of the $28.16 is "time value." With ≈$25 of intrinsic value already baked in, only about $3 per share is the time component. The original buyer captured the move; the closing transaction converted paper gains into cash.
This is hedge-unwind, not fresh positioning. The next-day OI print is definitive: OI fell by ≈12,162 (the trade size) rather than rising, confirming a net close. A fresh opening position would have raised OI. Falling OI means an existing holder exited. The desk took protection off — rational behavior after gold dropped ≈13% in a month and the put's value was near-peak.
The block cross mechanism underscores this. This was NOT a market participant sweeping exchanges to fill an urgent new position. A desk negotiated a pre-arranged block with a known counterparty to unwind a large protective position cleanly, with minimal market impact. No sweep verbs apply. The buyer on the other side of the cross is a new entrant taking on the risk the exiting desk is walking away from.
📈 Technical Setup
YTD Performance
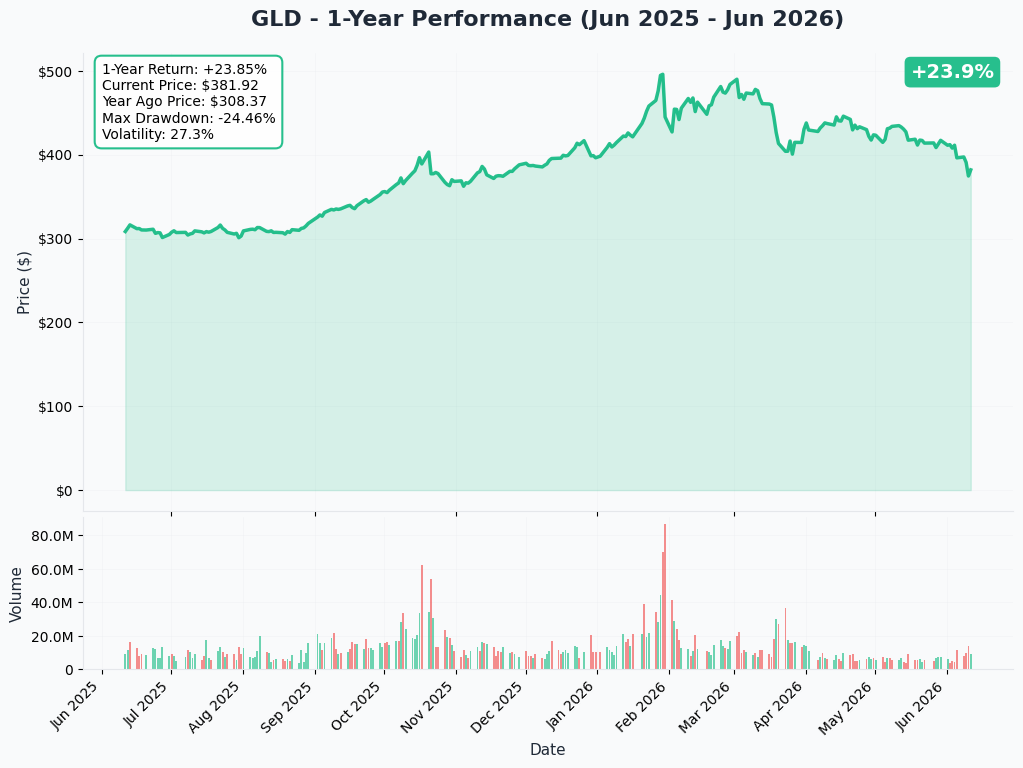
GLD has had a dramatic 2026. Gold printed an all-time high of ≈$5,589/oz (GLD equivalent ≈$559) on January 28, 2026, and has since entered its deepest pullback of the current cycle, per goldsilver.com's June 2026 outlook. The selling accelerated dramatically this week — per Yahoo Finance (June 11, 2026), gold opened below $4,100 for the first time since November 2025 and is down ≈7.9% on the week and ≈13.4% on the month.
GLD at $374.82 is down ≈4.2% YTD — an extraordinary reversal from January's all-time highs. This recent drop is the macro backdrop that makes both the profit-take AND fresh bearish reads plausible at the same time.
Gamma-Based Support & Resistance
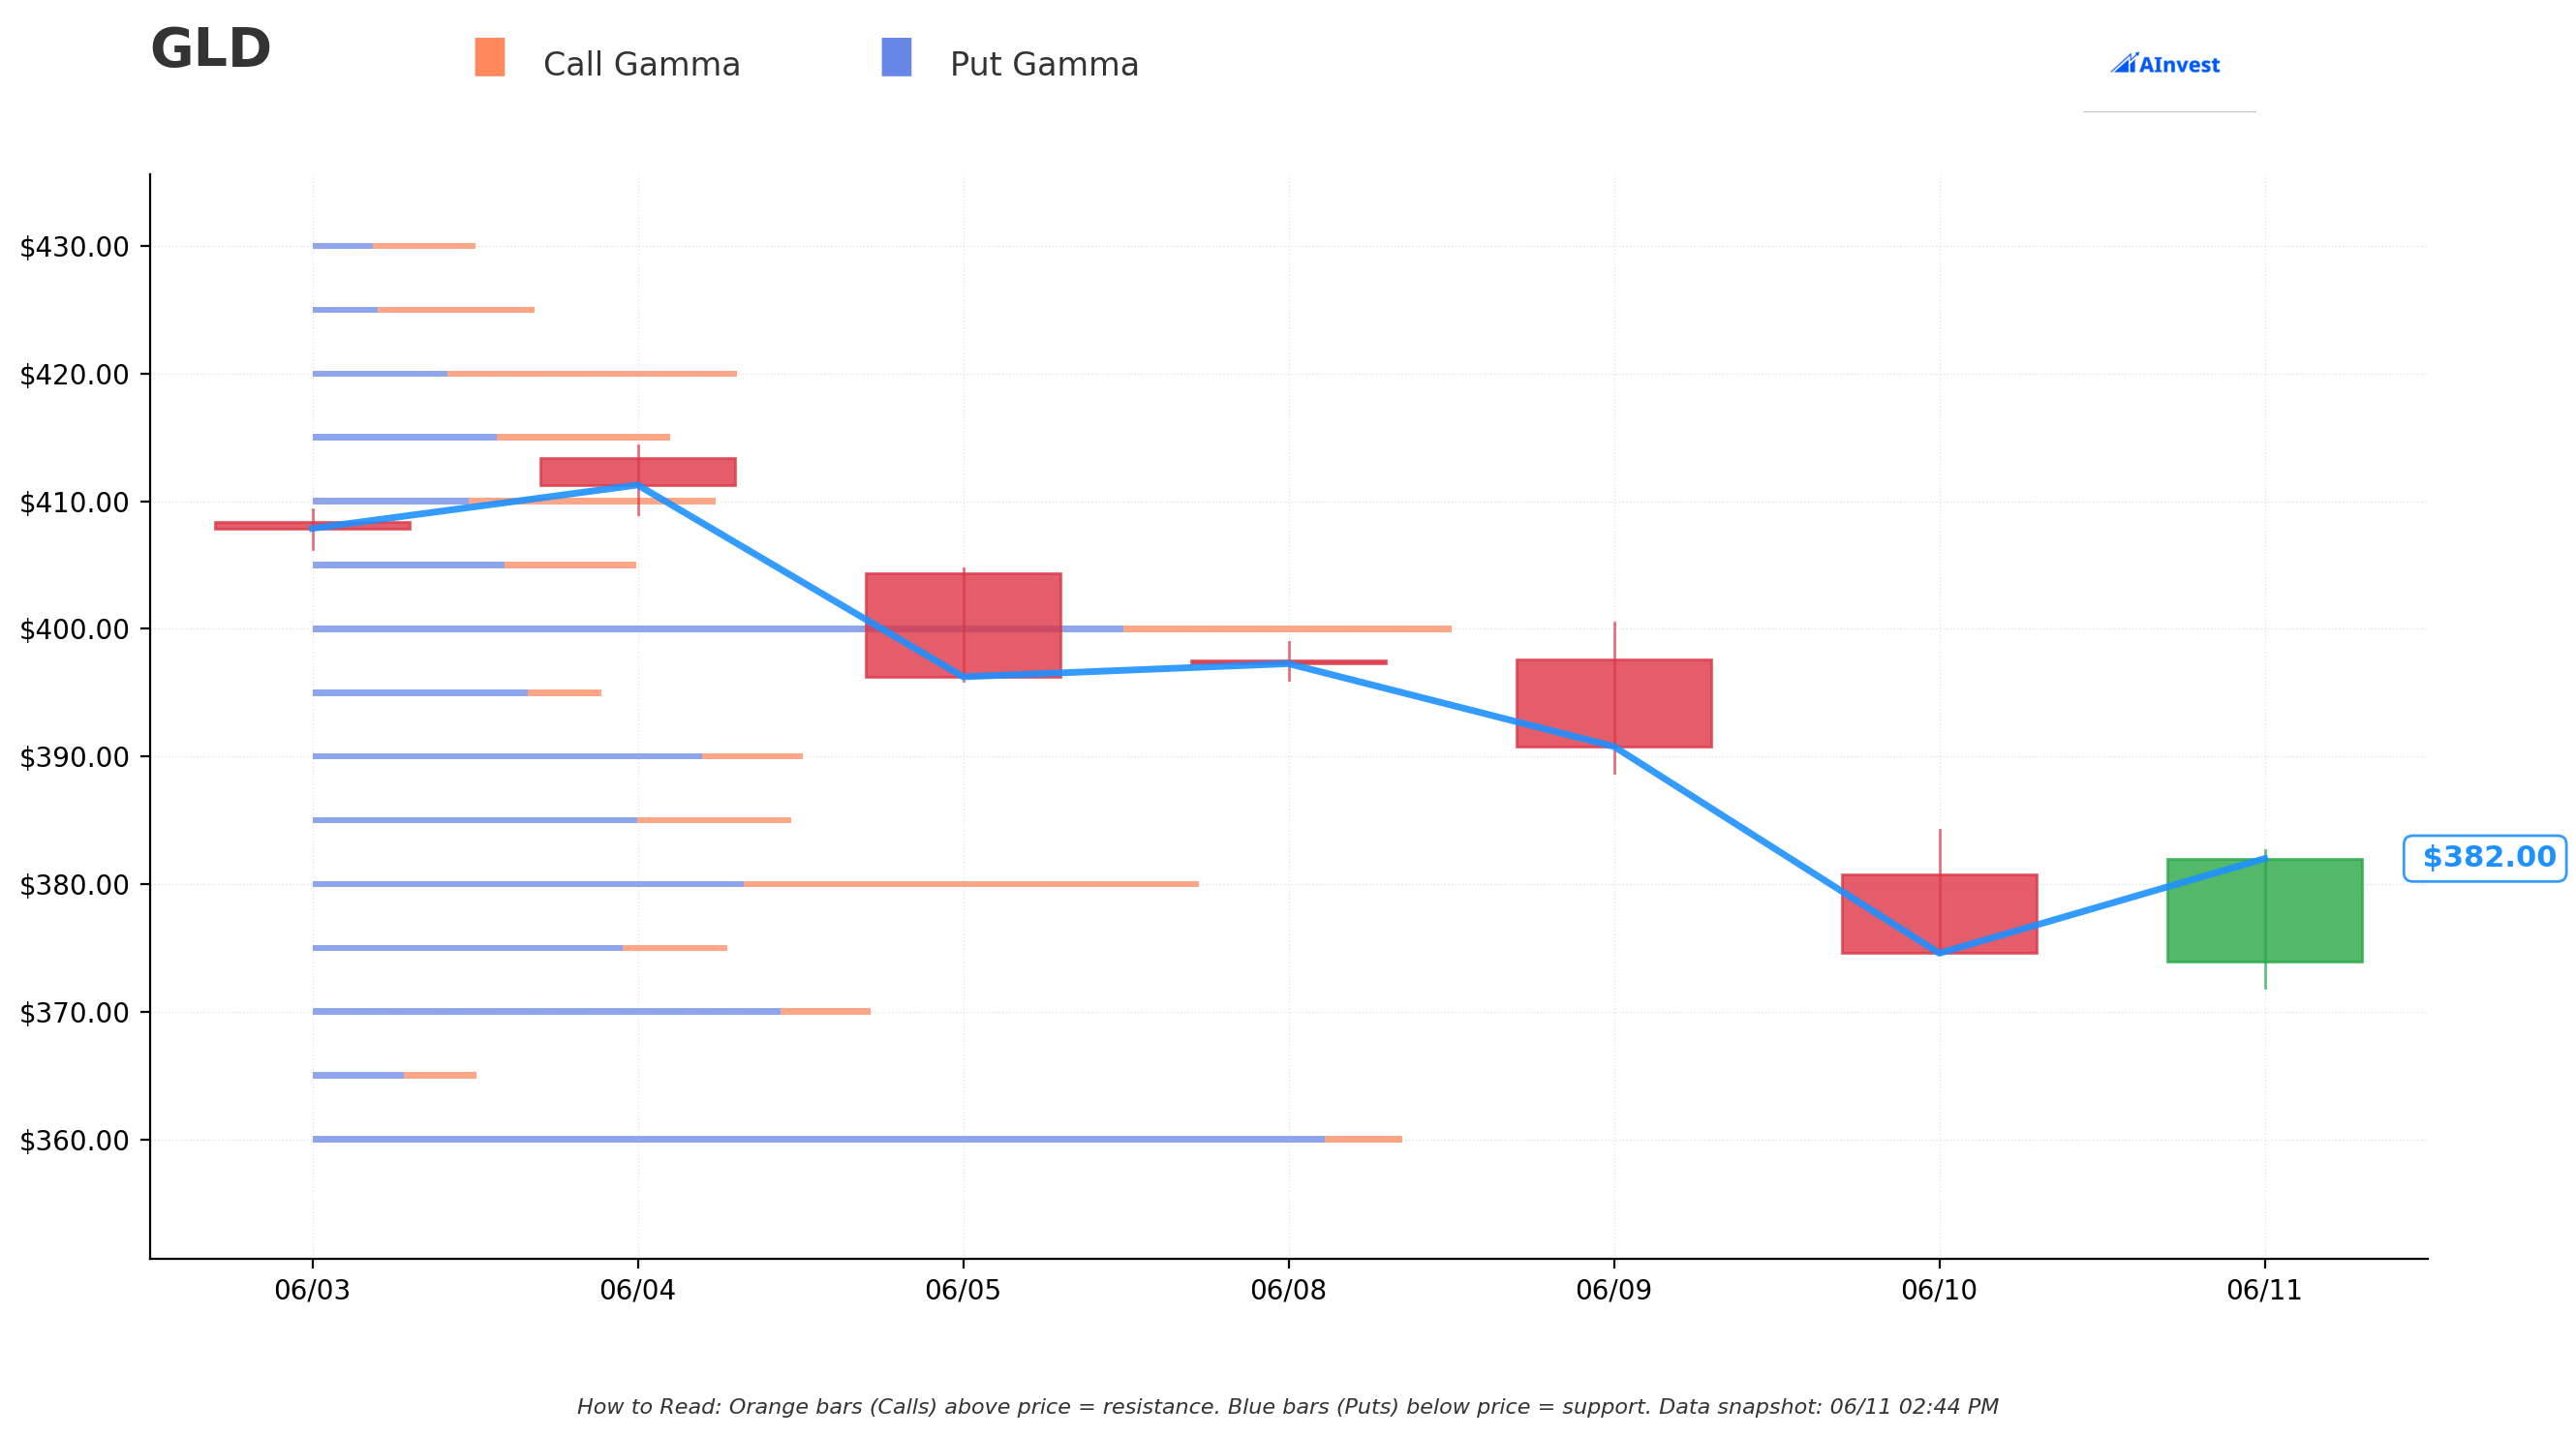
The gamma exposure chart shows the price levels where market-maker hedging creates gravitational force. Bigger bars = stronger magnetic levels. Current GLD spot ≈$382.17 at time of chart generation.
🔵 Support Levels (Put Gamma — market makers buy the dip near these):
- $380 — Very Strong: nearest support wall; the gamma floor right at current price
- $370 — Very Strong: secondary support; a decisive close below $380 opens this level
- $360 — Very Strong: major structural floor; a large concentration of put open interest anchors here
🟠 Resistance Levels (Call Gamma — market makers sell into rallies toward these):
- $385 — Very Strong: first ceiling above current price; needs a clean break to matter
- $390 — Very Strong: secondary resistance; call gamma builds here
- $400 — Very Strong: the $400 strike is the top gamma resistance wall — it is not a coincidence that today's block cross involves the $400 strike. This is where the most call gamma sits, creating a structural ceiling
What this means in plain terms: GLD is sitting right on the $380 gamma support. The $400 level functions as the ceiling for any near-term rally — and the traded strike. If GLD were to rally back toward $400 by July 17, the $400 put would lose most of its time value and approach pure intrinsic (≈$0 if at-the-money). That is the risk for any fresh long put holder. If GLD falls toward $370 and then $360, the put gains delta and value rapidly.
Implied Move Analysis
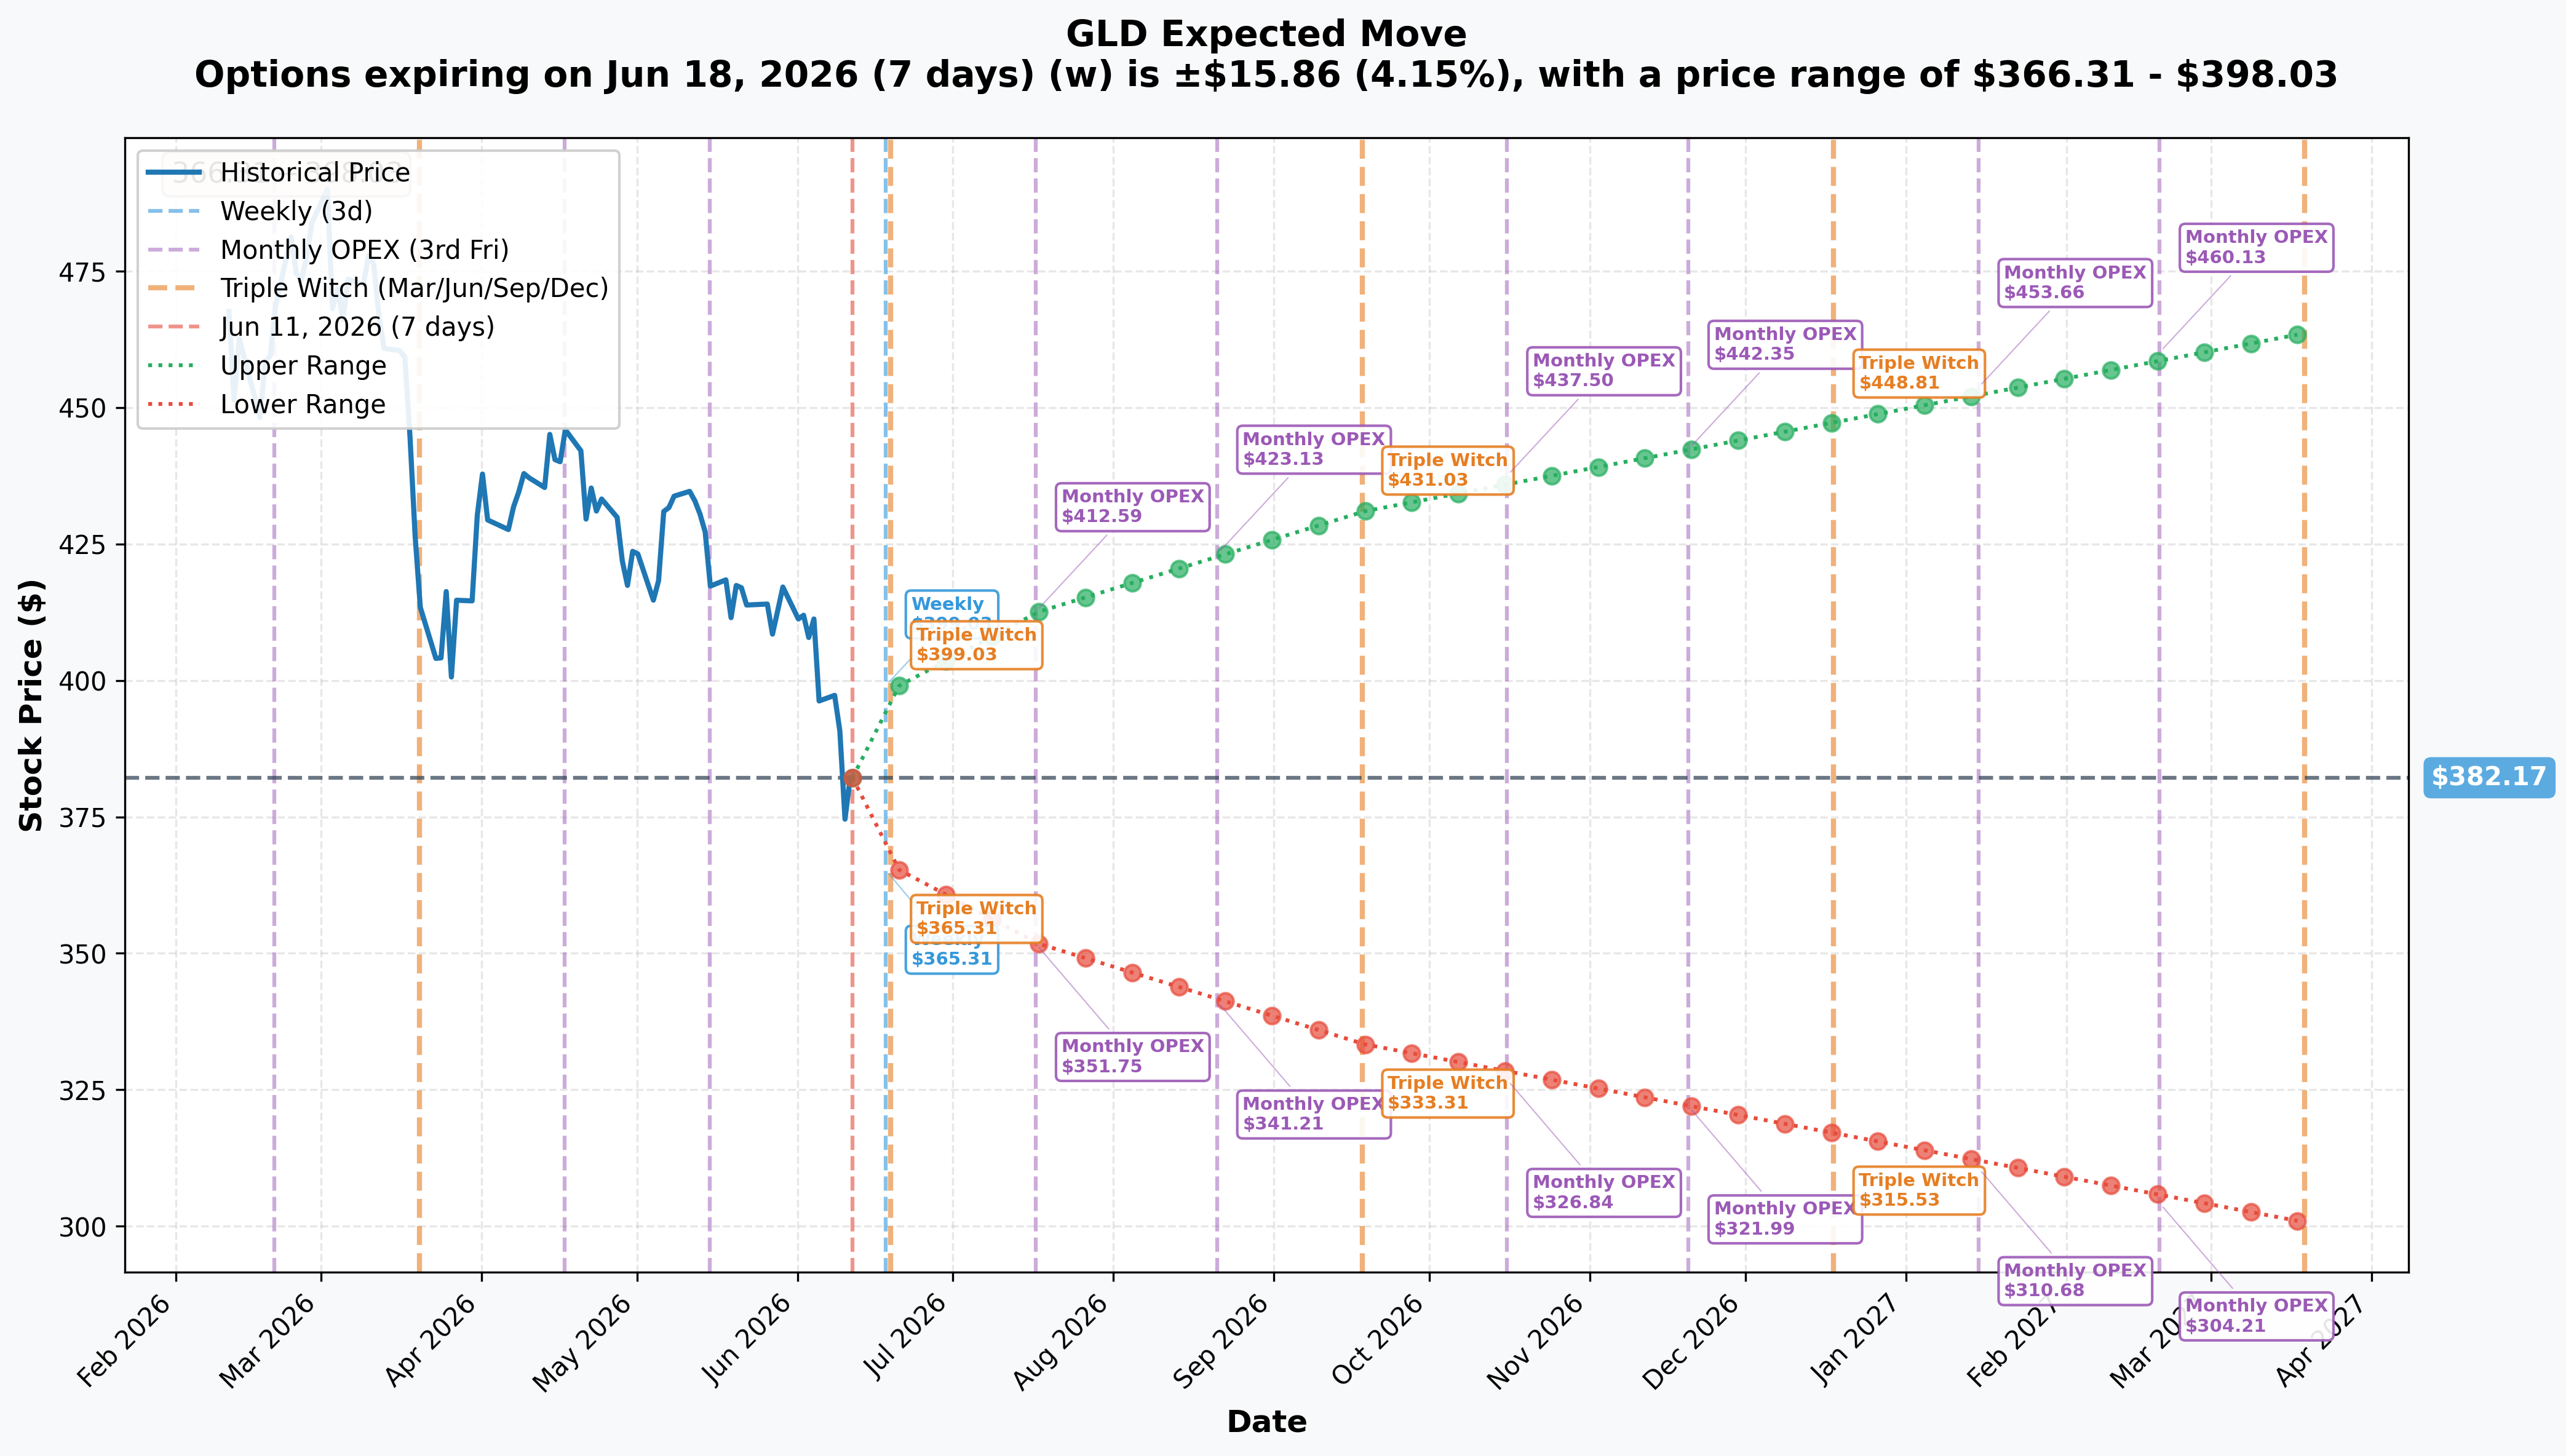
The options market is pricing the following move ranges from ≈$382.17:
| Expiration | Implied Move | Low | High |
|---|---|---|---|
| 2026-06-18 (weekly) | ≈±4.15% | $366.31 | $398.03 |
| 2026-07-17 (this put's expiry) | ≈±7.96% | $351.75 | $412.59 |
| Quarterly | ≈±12.79% | $333.31 | $431.03 |
Key observations:
The July 17 expiry — the exact expiration of today's put — has an implied range of $351.75 to $412.59. That means:
-
The $400 strike sits inside the upside of the implied range. The market prices a non-trivial probability that GLD could recover toward $400 by mid-July. If that happens, the put's intrinsic value would approach zero.
-
The downside floor of $351.75 is the scenario where the bearish thesis pays handsomely. At GLD $352, the $400 put is worth ≈$48 in intrinsic value versus the $28.16 paid — a solid gain.
-
The $366 weekly floor (June 18) is the first key level to watch — if GLD breaches it, momentum builds toward the monthly floor.
The FOMC is June 16–17 (just before the weekly expiry). That meeting alone could drive a ±4%+ move in gold.
🎪 Catalysts
🔥 Already Happened — The Bearish Drivers
Iran War / Strait of Hormuz closure (counter-intuitively bearish for gold) — escalating through June 2026: The U.S. launched fresh airstrikes on June 9–10 targeting Iranian military sites and Brent crude rose 1.8% to $91.10/bbl. But here is the paradox — gold FELL, per Yahoo Finance (June 11, 2026). The oil-driven inflation spike is raising real yields and strengthening the dollar — the two biggest headwinds for gold — and those are outweighing the safe-haven bid. Per CNBC (June 3, 2026), a stronger dollar during the Iran escalation has been an active drag on bullion.
May CPI spiked to 4.2% YoY — highest since April 2023: According to goldsilver.com's June 2026 gold outlook, the 4.2% YoY headline was driven by a 23.5% energy surge tied to the Iran conflict. Hot inflation kills rate-cut odds and lifts real yields — both bearish for a zero-yield asset like gold. The old rule that "inflation is good for gold" breaks down when inflation is forcing the Fed to stay hawkish.
Gold's deepest pullback of the 2026 cycle: Gold peaked at $5,589/oz on January 28, 2026, per goldsilver.com. The current level — gold opened below $4,100 for the first time since November 2025 on June 11 — represents the largest drawdown of the current cycle. Trend-followers are unwinding, per Yahoo Finance.
Structural central-bank buying floor (BULLISH counterweight): Central banks bought a net 244 tonnes in Q1 2026, above the five-year average, with Poland, Uzbekistan, and China all adding, per the World Gold Council Q1 2026 report. Critically, bar-and-coin demand hit its second-highest level ever as prices dipped — buyers stepped in on weakness, per Advantage Gold (2026). This structural bid is what separates gold from most other commodity selloffs — there is always a patient, price-insensitive buyer accumulating on the way down.
📅 Upcoming Catalysts — All Inside the Put's Life
FOMC June 16–17, 2026 (highest-impact near-term event): This is Kevin Warsh's first meeting as Fed Chair. The Fed calendar has the decision Wednesday June 17. Markets price ≈97% odds for a hold, per goldsilver.com — the HOLD itself is priced in. The real catalyst is the Summary of Economic Projections (the dot-plot) and Warsh's first press conference. A hawkish higher-for-longer tone (more dots pointing toward a December hike) = bearish gold. Any dovish surprise from a new Chair — even a hint of cuts being back on the table — = bullish gold snap.
May PCE — June 25, 2026: The Fed's preferred inflation gauge, per the BEA PCE release schedule. A hot print confirming the 4.2% CPI shock pushes real yields higher (bearish gold). A cooler core-PCE revives rate-cut speculation (bullish gold). This is the mid-point check inside the option's life.
June CPI — July 14, 2026 (last major print before July 17 expiry): Per the BLS CPI release schedule, the June CPI prints just 3 days before the put expires. This is the single highest-stakes data point for this specific option. If May's 4.2% is sticky, the put finishes ITM with gold under continued pressure. If inflation shows signs of rolling over, gold could snap back sharply.
Iran-war ceasefire OR escalation (highest-variance wildcard): With Al Jazeera (June 11, 2026) and ABC News live reporting ongoing strikes, a sudden ceasefire would collapse the oil-inflation premium and revive rate-cut odds — net bullish gold via lower real yields. Further escalation is mixed: more safe-haven demand (bullish) vs. more oil-driven inflation (bearish). Either direction could move gold 3–5% in a session.
🎲 Price Targets & Scenarios
Using gamma levels, implied move ranges, and the catalyst stack:
📉 Bear Case (favors a fresh long-put open)
Target: GLD $351–$366 (weekly/monthly implied floor)
Sticky inflation confirmed by PCE June 25 and June CPI July 14, a hawkish Warsh dot-plot on June 17, continued dollar strength from the Iran-war premium. Gold stays in sell-the-rally mode. The $380 gamma support breaks, which opens $370 and then $360. At GLD $360 on July 17, the $400 put is worth ≈$40 in intrinsic value — a ≈$12/share gain on $28.16 cost (≈42% return in 36 days). At GLD $352, intrinsic ≈$48 per share.
The gamma floor at $360 is the key domino — a weekly close below $370 would signal that level is next, and market maker hedging would become a tailwind rather than a cushion.
🎯 Base Case
Target: GLD $366–$385 (between implied floors and current gamma resistance)
Gold consolidates around current levels. The FOMC holds and Warsh stays cautious but not hawkish-hawkish. PCE comes in mixed. Iran talks stall without further escalation or de-escalation. GLD grinds in the $366–$385 band defined by the implied move and gamma walls. The $400 put holds its intrinsic value (stays ITM) but gains little additional value. If this is a new open, the holder holds and waits for the July 14 CPI catalyst.
📈 Bull Case (risk to any fresh long put)
Target: GLD $398–$412 (implied move upside)
A dovish Warsh surprise at his first FOMC (June 17), a sudden Iran ceasefire that deflates the oil-inflation premium and revives rate-cut odds, OR central-bank buyers aggressively stepping in at current levels. Goldman Sachs targets $5,400/oz year-end and J.P. Morgan models ≈$6,000 late-2026, per the goldsilver.com analyst roundup — those are not fringe numbers. If GLD rallies back toward $400 by July 17, the put approaches zero intrinsic value and expires nearly worthless. Maximum loss on a new open = $28.16 per share × 12,592 contracts × 100 = $35M.
💡 Trading Ideas — 4 Reader Types
🎰 YOLO Trader
Real talk: do not try to replicate a $35M block cross. What you CAN do if you agree with the bearish gold thesis is buy shorter-dated put spreads — for example, buying the $375 put and selling the $360 put for July 17 (defining your max risk on both sides). Cost is a fraction of the deep-ITM structure and keeps you in the trade if gold keeps sliding toward the $360 gamma floor. Size it so you can lose 100% and it does not hurt your account.
📈 Swing Trader
Watch for GLD to fail the $380 gamma support on a daily close — that is the technical signal the bearish momentum is resuming. A close below $380 → target $370, then $360. A close ABOVE $385 → the bull case is gaining traction and the bearish put thesis is under pressure. A put debit spread (buy $375P / sell $360P, July 17 expiry) has a defined max loss and does not require you to be right by as much as today's deep-ITM structure. Track the June 17 FOMC dot-plot as the first binary catalyst.
🛡️ Premium Collector
The $400 gamma resistance wall overhead is your friend. Selling covered calls at the $390 or $400 strike against an existing GLD position collects premium while respecting the strong call-gamma ceiling. You are the counterparty collecting time value that others are paying. The $400 level as top gamma resistance makes it a mechanically attractive covered-call strike — market makers will sell into any rally approaching that level, keeping the pressure on. Just watch that FOMC closely; a dovish surprise could gap GLD through resistance fast.
🐣 Entry-Level Investor Getting Started
Here is the plain-English version of what happened today: a very large institution either (A) made a $35M bet that gold keeps falling through mid-July, OR (B) collected $35M in profits by selling puts they bought when gold was much higher. We genuinely do not know which one yet. What you should take away: gold is in its biggest pullback of the year, driven by inflation that is keeping the Fed hawkish — but the long-term case for gold (central banks buying, analyst targets well above current prices) is NOT broken. If you own GLD shares and are worried, watch the $380 support level. If it holds, the pullback may be running out of steam. If it breaks, the next stop according to gamma analysis is $370.
⚠️ Risk Factors — What Could Go Wrong
1. The block cross mechanism does NOT tell us direction. This is the most important disclaimer in this article. A desk matched a buyer and seller. The "BUY" label on the tape means a buyer took the position — but it could be the buyer in a fresh new open OR the buyer who is now on the other side of someone closing a long put. We will not know until tomorrow's OI print.
2. Central-bank buying is the structural floor that does not flinch at rate moves. The World Gold Council reports 244 tonnes of Q1 2026 buying with J.P. Morgan projecting ≈800 tonnes for the full year. These buyers do not trade options; they accumulate metal at any price. That is a structural bid every bearish short is fighting against.
3. Street consensus sits far above current spot. Goldman targets $5,400/oz year-end, UBS $5,500, J.P. Morgan models toward $6,000, per goldsilver.com's analyst forecast roundup. Even Commerzbank, the most bearish, targets $4,800 — all well above today's print. If any of those bull case scenarios materialize, GLD rallies through $400 and the put buyer (if this is a fresh open) loses the full $35M by expiry.
4. Iran ceasefire or Warsh dovish surprise = violent gold snap. One headline — a ceasefire announcement, a Warsh press conference that sounds more dovish than expected — could move GLD 4–6% in a single session. The $400 implied move has a $398 upside for the upcoming weekly (June 18), per our implied-move analysis. That is how quickly a deep-ITM bear thesis can get run over.
5. Goldman itself flags near-term downside/liquidation risk. Per Investing.com (Goldman downside commentary), there is acknowledgment that forced selling could continue near-term. But that is a near-term/technical observation — Goldman still holds $5,400/oz as their year-end base case.
6. The $400 strike is the top gamma resistance wall. Any rally toward that level would be mechanically suppressed by market-maker hedging (selling calls, buying puts to hedge). This creates a gravitational pull that works against a short-squeeze back to $400+ — which is a double-edged risk for the put: good if gold stays below $400, bad if there is a forced short squeeze.
🎯 The Bottom Line
The resolved picture: A desk exited a $35M protective put position on GLD — it was not a fresh bearish bet. Open interest fell by ≈12,162 overnight (44,132 → 31,970), matching the 12,592 traded, confirming a close. The desk that had been holding deep-ITM $400 puts as downside protection — very likely established when gold was near or above $400 — took those gains off the table after GLD's ≈13% one-month decline. The $35M was capital flowing OUT of an existing hedge, not new conviction that gold has further to fall.
What this does NOT mean: It does not mean the bearish-gold thesis is wrong. It means one institution decided to crystallize gains on their existing protection ahead of the FOMC (June 16–17). The macro headwinds — 4.2% CPI, oil-driven inflation, a hawkish Fed under Warsh — are unchanged. Someone else is now on the other side of that block cross, holding the $400 puts. The risk transfer happened; the macro question remains open.
If you believe gold has further to fall: Watch for a daily close below the $380 gamma support as the technical trigger. The $370 and $360 levels below it are the next gamma floors, and breaking through them would add momentum. The June 17 FOMC dot-plot is the binary near-term catalyst — hawkish language = bearish gold.
If you believe gold will recover: The central-bank buying floor, the $5,400–$6,000 year-end analyst consensus, and the genuine possibility of a dovish Warsh surprise or Iran ceasefire all support the structural bull case. A relief rally from current oversold levels back toward $385–$390 is not an unreasonable scenario before July 17.
Key upcoming catalysts (still relevant):
- 📅 June 16–17 — FOMC decision + Warsh's first dot-plot press conference
- 📅 June 25 — May PCE (the Fed's preferred inflation gauge)
- 📅 July 14 — June CPI (last major print before the July 17 put expiry)
- 📅 July 17, 2026 — GLD $400 put expiration
⚠️ Disclaimer: Options trading involves substantial risk of loss and is not suitable for all investors. This analysis is for educational purposes only and does not constitute financial advice. Deep-in-the-money options behave differently from standard option structures; the block cross mechanism indicates an institutional-scale negotiated trade that is not readily replicable by retail traders. The open/close classification has been ✅ OI-CONFIRMED as a close — open interest fell 44,132 → 31,970 (Δ −12,162 ≈ the 12,592 traded). Always conduct your own research and consider consulting a licensed financial advisor before trading. Past unusual flow does not guarantee future results.
Last updated: June 12, 2026 | Options flow date: June 11, 2026