HD: $2.9M Deep ITM LEAP Call Sold — Stock Replacement Exit or Covered Position Monetization?
📅 March 18, 2026 | 🔥 Unusual Activity Detected
🎯 The Quick Take
Someone sold 500 Home Depot LEAP calls at the $300 strike for Jan 2027 — collecting $2.9 MILLION in premium — with volume dwarfing open interest 3:1. The $300 strike is $36.74 in-the-money with the stock at $336.74, making this deep ITM LEAP a high-delta, stock-equivalent position. This is not a speculative bet; it is an institutional monetization event — likely a covered call roll, a long stock exit via synthetic short, or a buy-write on a position that was entered near the $300 level. With Home Depot down 18% from its December 2024 ATH and facing FOMC day headwinds, this seller is either locking in gains at a specific exit point or generating income on a position they intend to deliver if called away.
🏢 Company Overview
The Home Depot (HD) is the world's largest home improvement retailer, operating over 2,300 stores in North America. The company recently completed the $5.5B acquisition of GMS Inc. (March 5, 2026), expanding its specialty trade distribution platform for Pro customers.
| Metric | Value |
|---|---|
| Sector | Lumber & Building Materials Retail |
| Market Cap | ~$341B |
| Current Price | $334.84 (GEX timestamp) |
| 52-Week Range | $310.00 – $418.00 |
💰 The Option Flow Breakdown
📊 What Just Happened
| Time | Side | C/P | Expiration | Strike | Premium | Volume | OI | Spot | Contract |
|---|---|---|---|---|---|---|---|---|---|
| 10:04:58 | BID / SELL | CALL | 2027-01-15 | $300 | $2.9M | 501 | 159 | $336.74 | HD20270115C300 |
Structure: STO (Sell to Open) — 500 contracts, deep ITM LEAP call | ~10 months to expiry
🤓 What This Actually Means
At first glance, selling a deep ITM call for $58 looks like giving up. Here is why it is not:
Decomposing the $58 Option Price at $300 Strike / $336.74 Spot:
- Intrinsic value: $336.74 − $300.00 = $36.74
- Extrinsic (time) value: $58.00 − $36.74 = $21.26 (~36% of total premium)
- Delta: Deep ITM LEAP calls carry delta of 0.85–0.92 — essentially a stock substitute
Volume vs. OI Analysis:
- Volume 501 vs. OI 159 = 3.1x — this is almost certainly an opening sell, not a close
- The seller is establishing a new short call position (or writing covered calls against existing stock)
Why Would Someone Sell Deep ITM LEAP Calls?
There are three dominant interpretations for this trade:
-
Covered Call / Buy-Write Against Long Stock: The seller owns ~50,100 shares of HD (500 contracts × 100) bought near $300 or lower. By selling the $300 Jan 2027 LEAP call for $58, they generate $5.8M in upfront premium on a ~$16.8M stock position (roughly 35% of position value). If called away at $300, they exit at a net effective price of $358 ($300 strike + $58 premium). This is a rational exit strategy for a long-term holder looking to book gains above current prices or generate income while waiting for recovery.
-
Stock Replacement Monetization Exit: The seller may hold synthetic long exposure (long LEAP calls or stock options) purchased near the $300 level. Selling the deep ITM call locks in the mark-to-market gain by collecting most of the intrinsic and a substantial time premium. Effective exit level = $58 in premium effectively reduces basis to $278 ($336.74 − $58) if the stock delivers.
-
Institutional Covered Write / Pension Rebalancing: Institutions managing large HD equity positions routinely write covered calls at prior cost-basis levels during periods of weakness. With HD down 18% from its $418 ATH, a manager who built a position at $290–$310 would see the $300 level as a natural covered call strike — they collect $58 in income and cap upside at $300 + $58 = $358 effective delivery.
Key Structural Point: The $21.26 in time value collected represents the "true" income from this trade. The seller is being compensated $21.26/share for the risk that HD stays above $300 through Jan 15, 2027 — which, at 99% probability given current spot, is essentially guaranteed. The seller is forgoing any upside above $358 effective price.
📈 Technical Setup / Chart Check-Up
YTD Performance
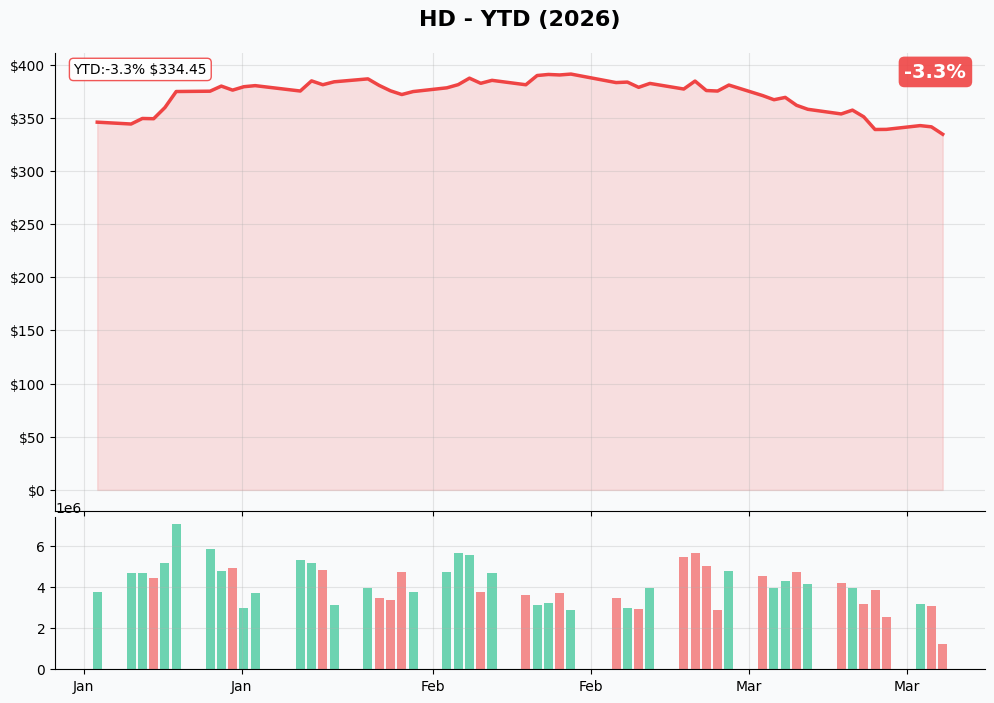
Home Depot has declined approximately 18% from its December 2024 ATH of $418.08, trading in the $330–$345 range through early March 2026. The GMS acquisition close on March 5 provided a brief catalyst, but the stock remains trapped below the $350 resistance zone. The February 24 Q4 2025 earnings beat (EPS $2.72 vs $2.54 consensus) was insufficient to reignite the stock, as the FY2026 guidance of flat-to-+2% comparable sales disappointed traders expecting a housing recovery setup.
Key Technical Observations:
- 📉 Stock trading in a descending channel from $418 ATH since late 2024
- ⚠️ $350 is the key recovery pivot — close above here changes the technical narrative
- 🟡 $330 has emerged as near-term support with put GEX concentration providing cushion
- 📊 Volume on the Feb earnings move was below average — lack of conviction in either direction
Gamma-Based Support & Resistance Analysis
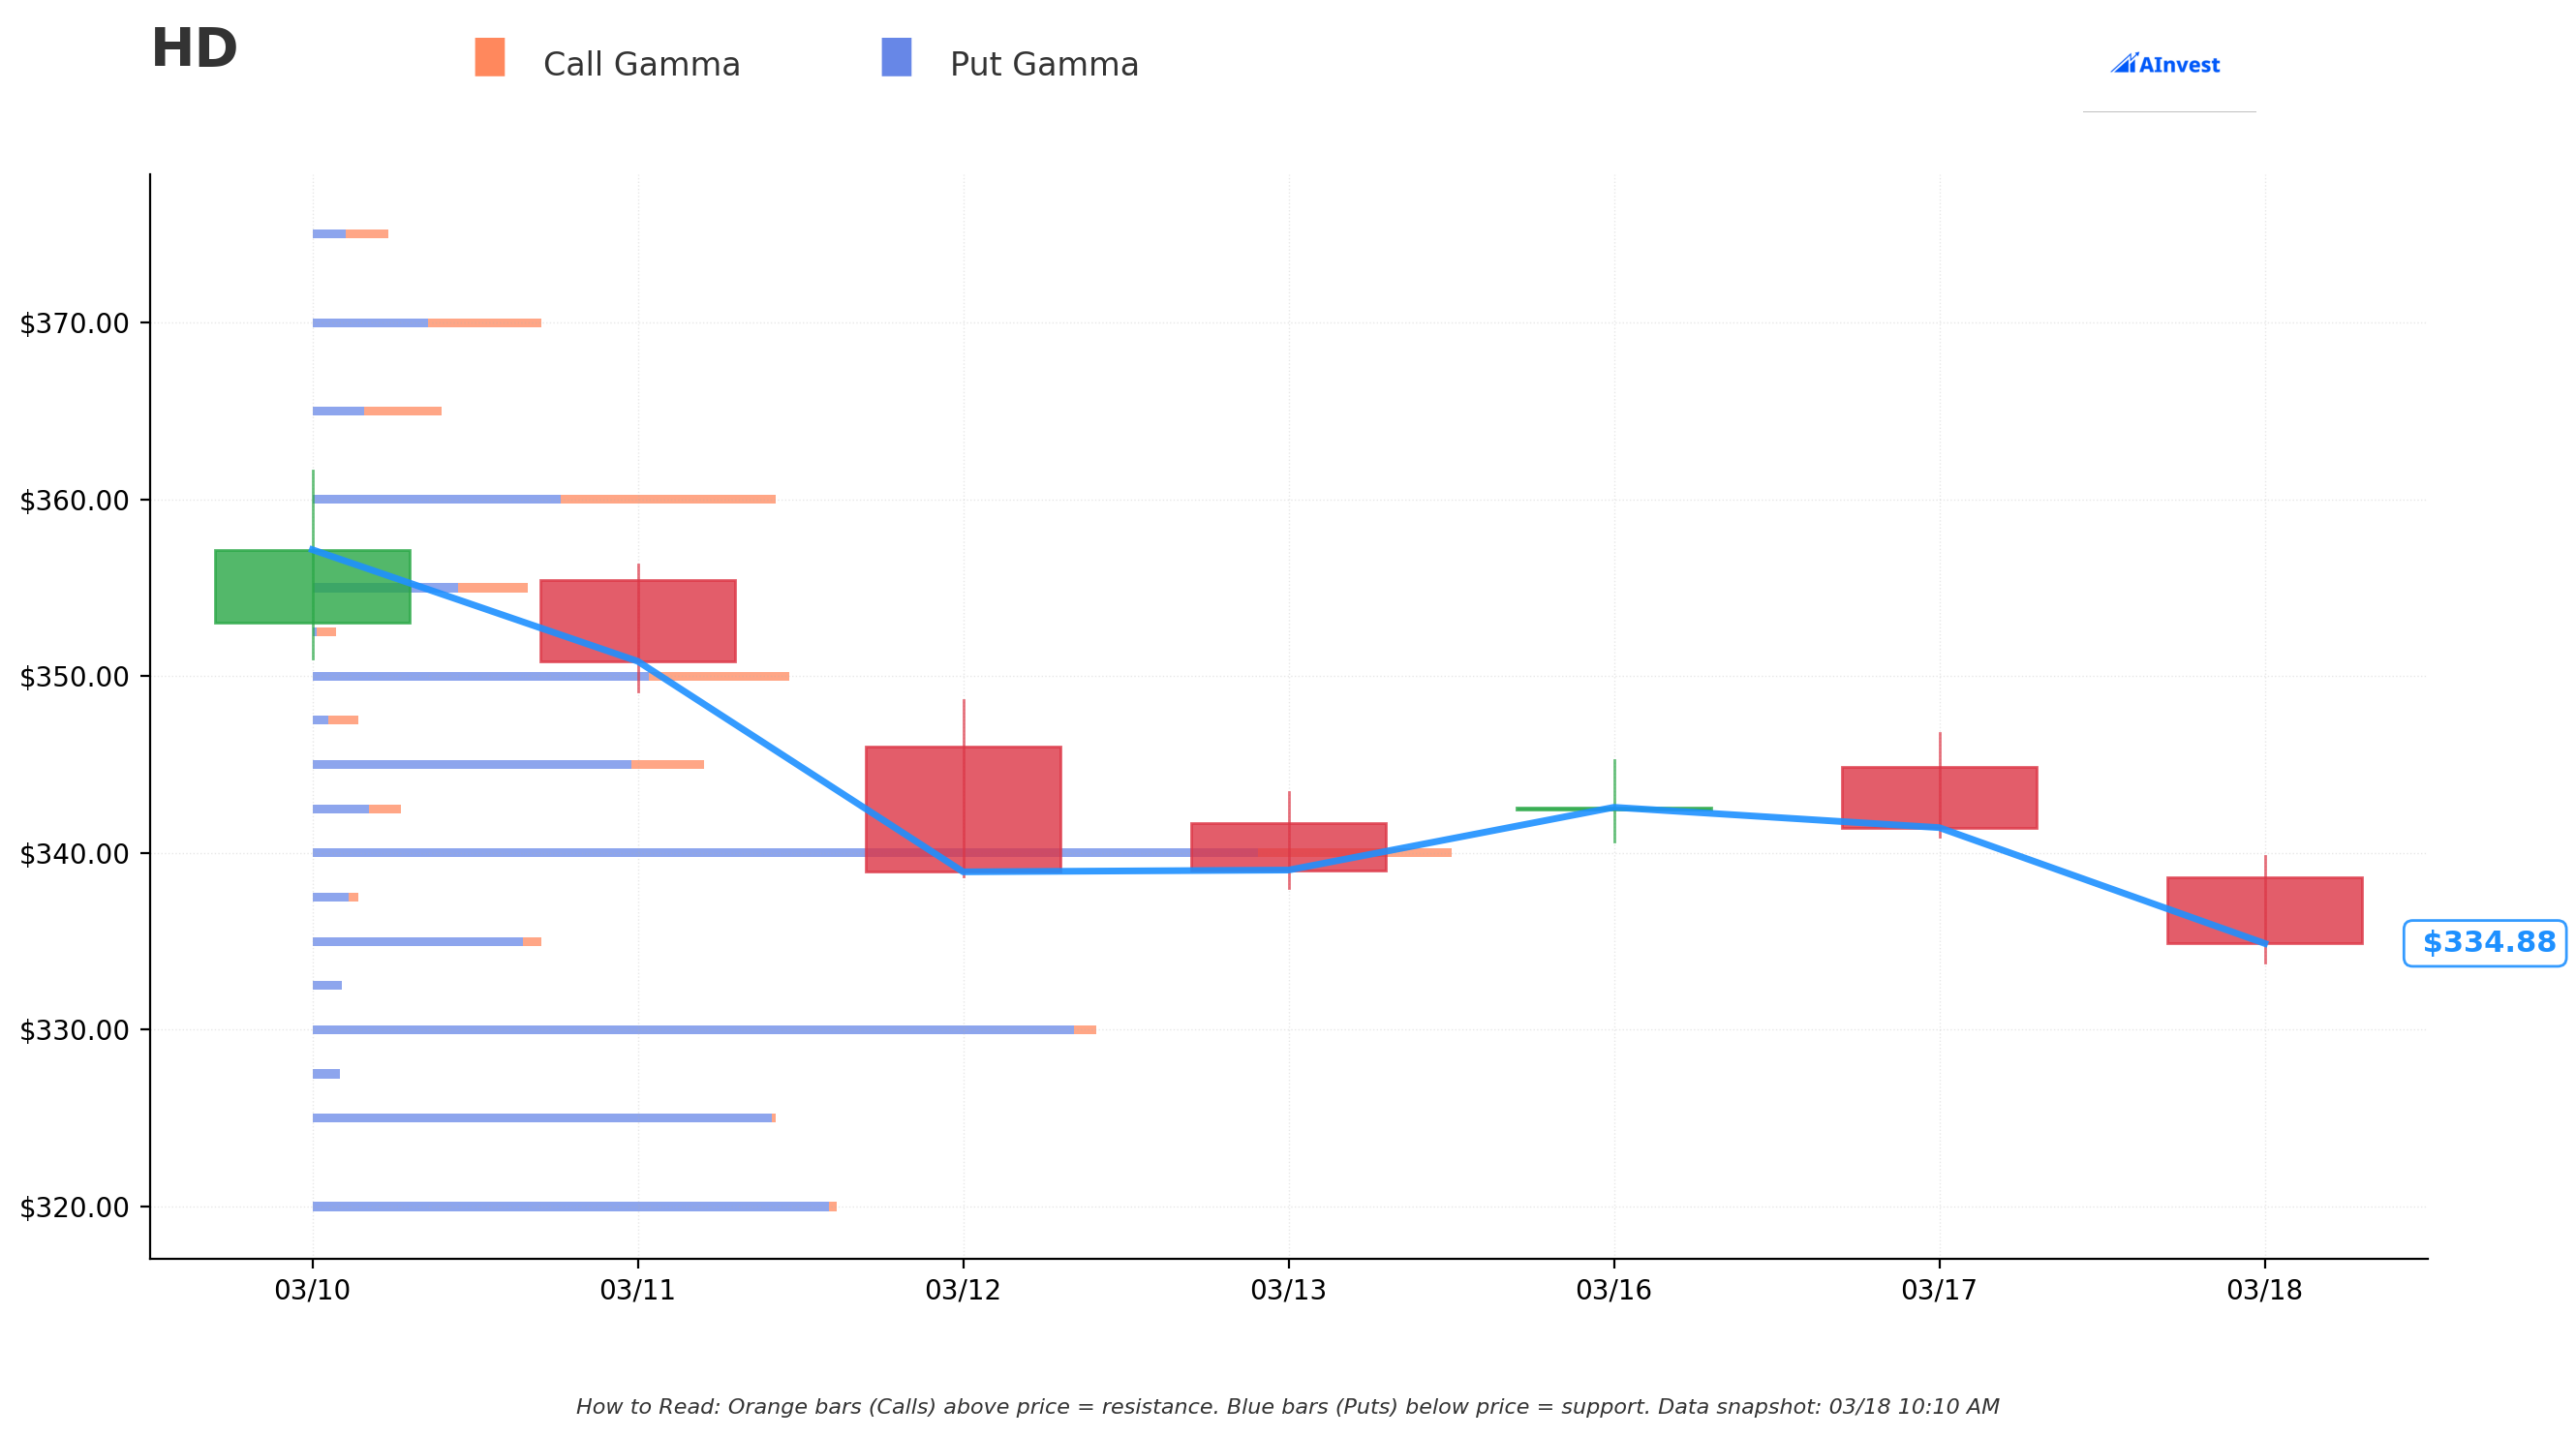
Key Gamma Levels (from GEX data, spot ~$334.84):
| Level | Type | Total GEX | Notes |
|---|---|---|---|
| $330 | Support | 4.640 | Strongest near-term floor — massive put GEX accumulation |
| $325 | Support | 2.750 | Secondary put gamma cushion ~2.9% below spot |
| $320 | Support | 3.102 | Structural support — 4.4% below spot |
| $315 | Support | 1.544 | Deep support band, 5.9% below spot |
| $340 | Resistance | 6.745 | Strongest resistance — heavy net negative GEX |
| $345 | Resistance | 2.325 | Secondary wall |
| $350 | Resistance | 2.876 | Key recovery pivot, 4.5% above spot |
| $360 | Resistance | 2.756 | Major ceiling if $350 clears |
GEX Summary:
- Total Call GEX: 12.32 | Total Put GEX: 31.14
- Net Bias: Bearish (put GEX nearly 2.5x call GEX)
- The dominant put GEX concentration in the $320–$340 range confirms dealers are short puts in this zone — they will buy stock on declines, providing support. But the net bearish GEX bias also signals overhead call dealer selling pressure on any rally.
- The $340 resistance is critical: with $6.75 total GEX, this is the largest single options wall in the stack. Today's FOMC decision creates the primary catalyst for a $340 break-or-hold.
Reading the Gamma Chart:
- 🔵 Blue bars (Put Gamma) = Support zones where dealers must buy stock to hedge
- 🟠 Orange bars (Call Gamma) = Resistance zones where dealers must sell stock to hedge
The deep ITM $300C seller is well within the safety zone for the structure — spot would need to decline ~10% to $300 before the option approaches the money from the seller's assignment perspective.
Implied Move Analysis
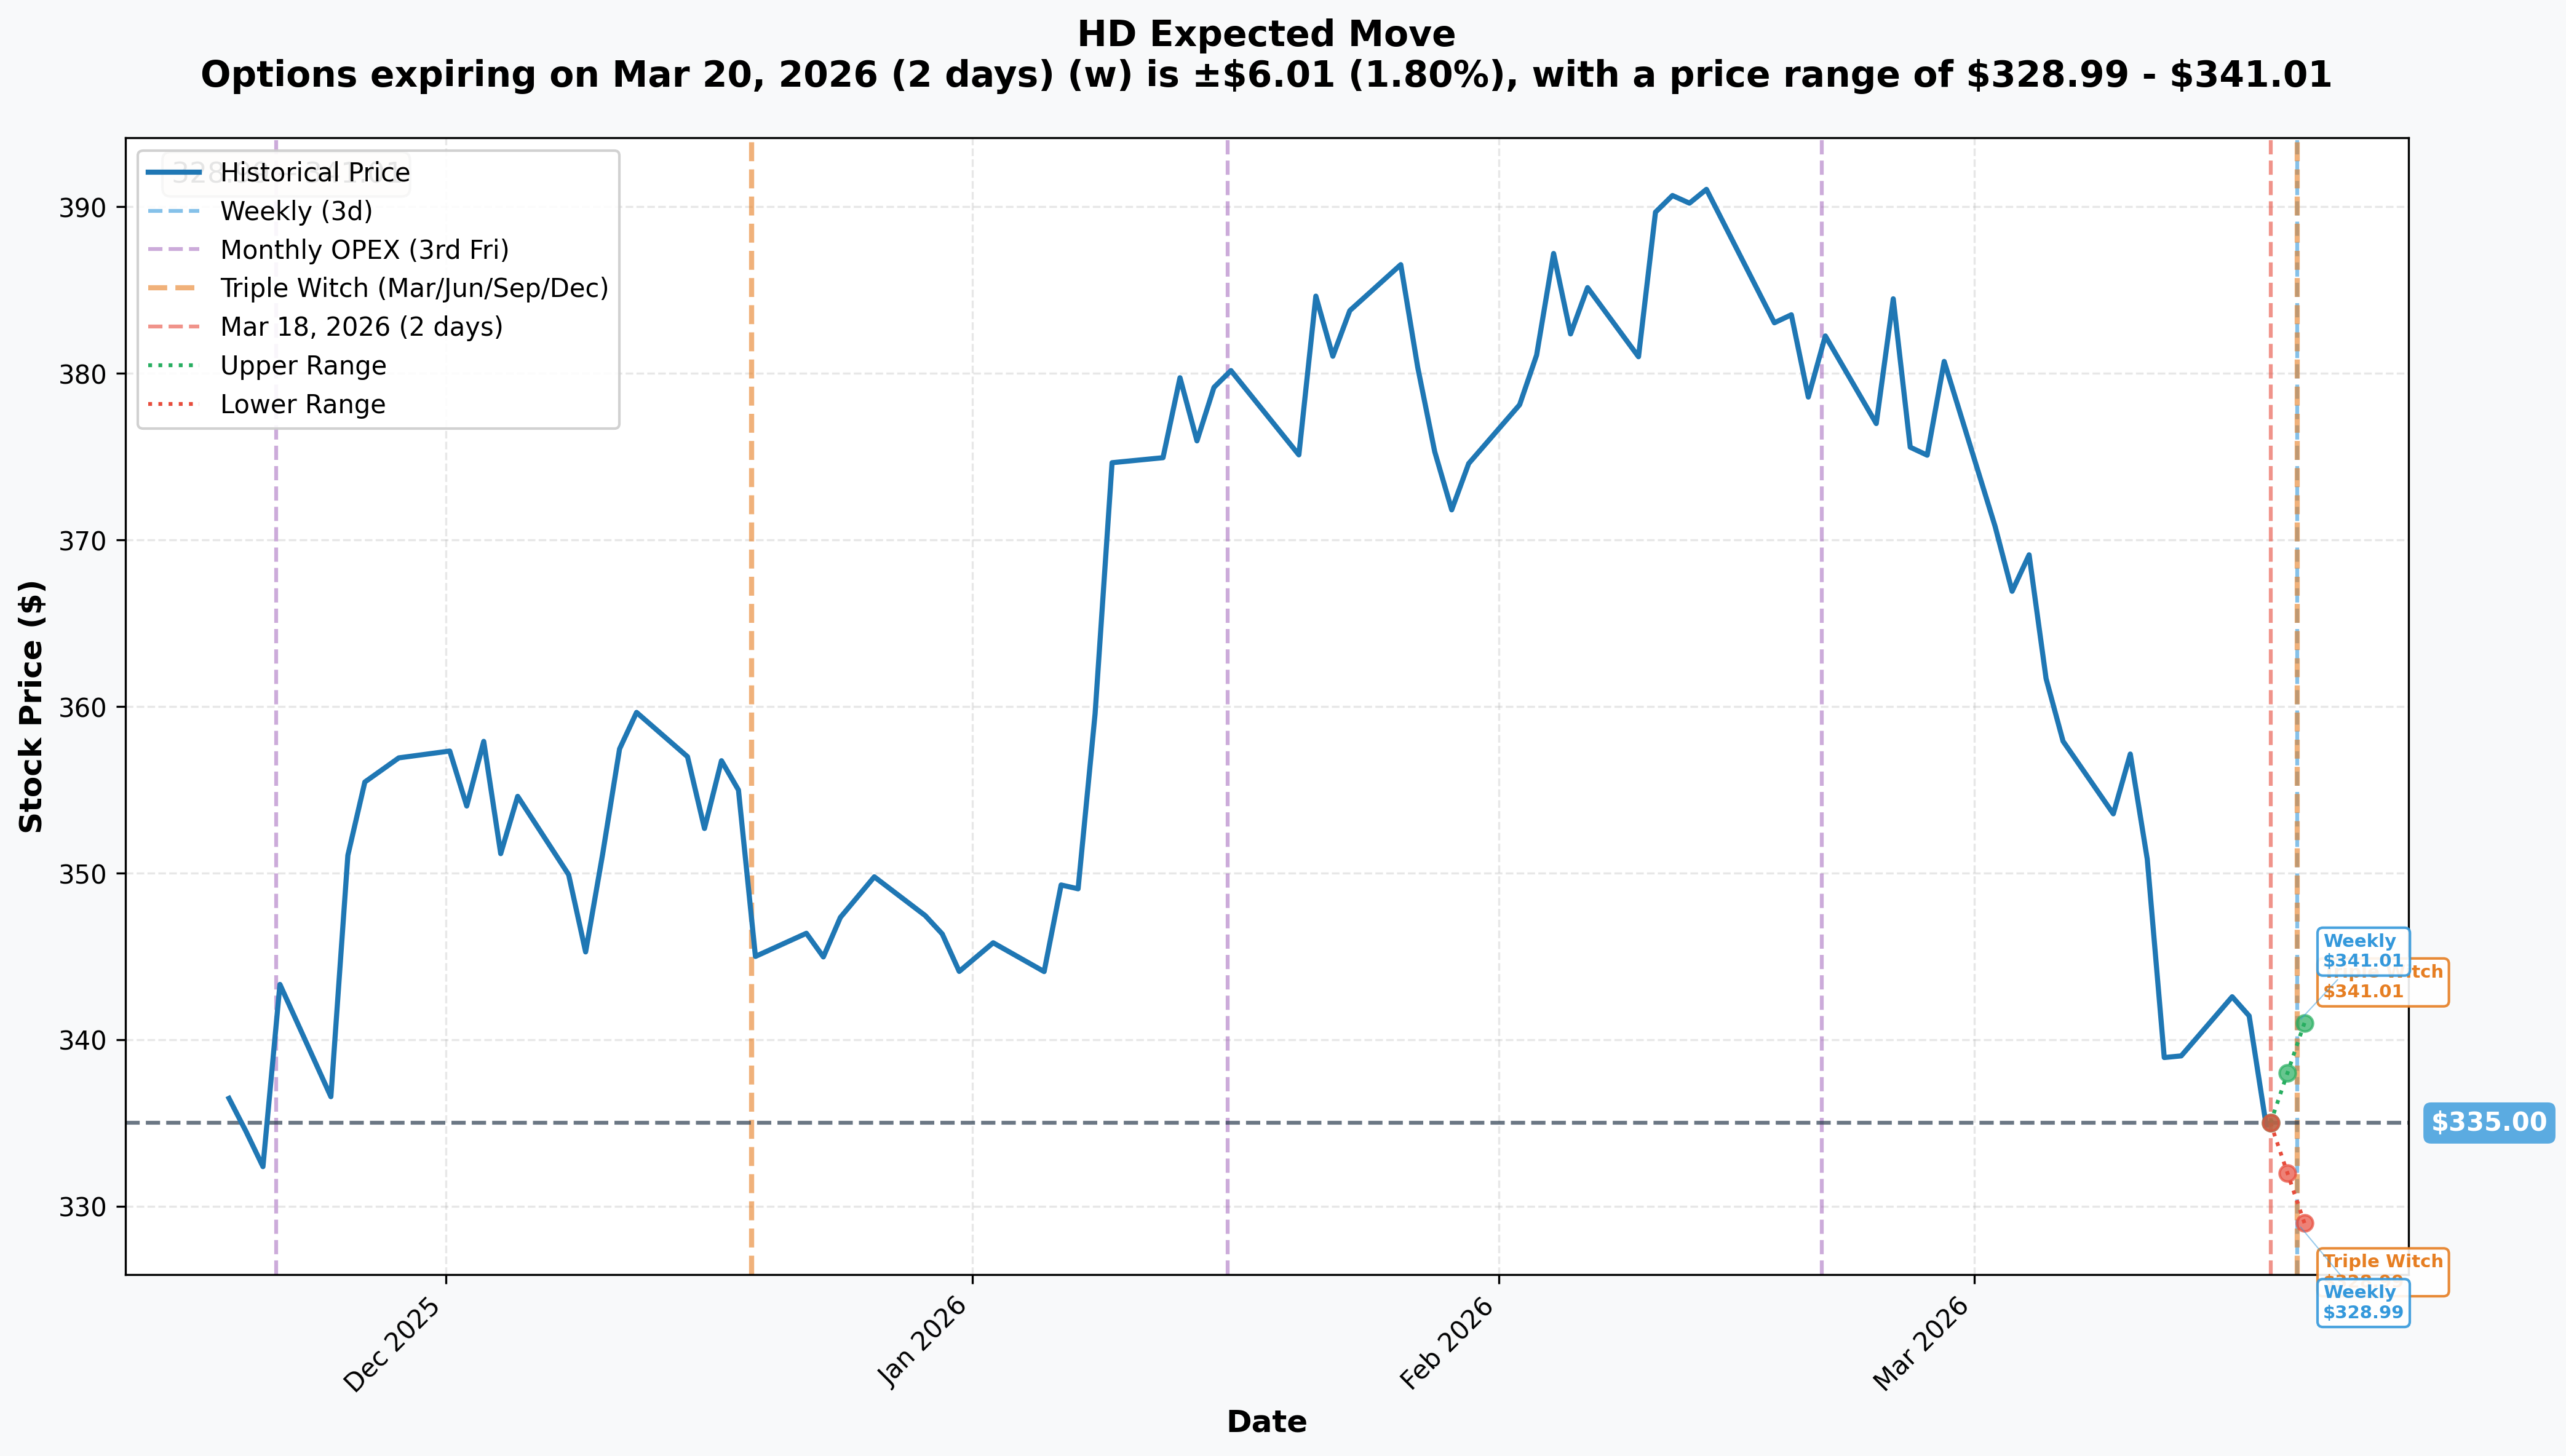
Options Market Expected Ranges (as of March 18, 2026):
| Timeframe | Expiry | Expected Move | Upper Range | Lower Range |
|---|---|---|---|---|
| Weekly / Triple Witch | 2026-03-20 | ±1.8% / ±$6.01 | $341.01 | $328.99 |
| Monthly OPEX (same) | 2026-03-20 | ±1.8% / ±$6.01 | $341.01 | $328.99 |
With Triple Witch on Friday March 20, the options market is pricing a very contained ±1.8% move this week. The upper bound of $341.01 sits just above the $340 gamma resistance wall — the market is essentially saying the most likely outcome for this week is a pin between $329 and $341.
For the Jan 2027 $300 LEAP Call:
- At $58 per contract, the seller collected 17.2% of the stock price in upfront premium
- The $300 strike is 11.2% below current spot — there is zero realistic path to this option expiring OTM unless HD falls more than $34.84 from current levels
- The seller's breakeven at delivery is $300 + $58 = $358, which is 6.3% above current spot and near the $350–$360 resistance zone
- Time value of $21.26 decays to zero by Jan 15, 2027 — the seller captures this regardless of stock direction as long as HD stays above $300
🎪 Catalysts
📅 Upcoming Catalysts
| Date | Event | Relevance to the LEAP Call Sale |
|---|---|---|
| March 18, 2026 — TODAY | FOMC Rate Decision | Market expects a hold at 3.50%–3.75%; dovish dot plot could lift HD toward $340–$345 resistance. A hawkish surprise compresses the stock — seller benefits either way as deep ITM call value is insensitive to $10–$15 moves |
| March–June 2026 | Spring Selling Season | Most critical period for HD revenue; strong spring could be the catalyst for a $350+ break |
| ~May 19, 2026 | Q1 FY2026 Earnings | Key metrics: comparable sales trajectory (guided flat to +2%), SRS/GMS integration contribution, spring demand indicators |
| 2026 | GMS Integration Milestones | Cross-selling synergies from the combined SRS+GMS platform — potential $50B TAM expansion in Pro market |
| 2026 | Mortgage Rate Trajectory | Rates stuck above 6%; any break below 6% could unlock housing turnover and renovation spend — the true bull catalyst |
⏮️ Recent Catalysts (Already Happened)
| Date | Event | Outcome |
|---|---|---|
| March 5, 2026 | GMS Acquisition Closed ($5.5B) | Adds ~$50B to HD's addressable Pro market; stock reaction muted |
| Feb 24, 2026 | Q4 FY2025 Earnings | EPS $2.72 vs $2.54 consensus (beat); revenue $38.2B, comps +0.4%; FY2026 guidance flat-to-+2% disappointed |
| Feb 25, 2026 | Multiple Analyst Upgrades | UBS set $450 PT; consensus 25 Buys / 11 Holds implies 25–32% upside from current levels |
| Jan 1, 2026 | Lumber Tariff Escalation | Canadian softwood lumber at 45%; cabinet tariffs rose to 50%; HD committed to not passing through to consumers |
🎲 Price Targets & Probabilities
For the deep ITM LEAP call seller, the analysis inverts: the question is not where HD goes, but where it must not go for the trade to work.
✅ Winning Scenario for the LEAP Seller — Stock Stays Above $300
HD Range: $300–$420 by January 2027
- Probability: ~93–95%
- Mechanics: At any price above $300 at Jan 15, 2027 expiry, the call is exercised and the seller delivers shares at $300 (effective delivery price = $358 with premium included). The seller has generated $21.26 in pure time value (income) regardless.
- Best outcome for seller: HD closes somewhere in $335–$358 range. They keep full $58 premium AND had their stock essentially working for them the whole time
- Moderately good: HD closes at $380–$420. Seller captures full $58 premium but leaves $22–$62 per share of upside on the table vs. holding outright stock
⚠️ Risk Scenario for the LEAP Seller — Stock Falls Below $358 by Expiry
HD Range: $300–$358 by January 2027
- Probability: ~35–40%
- Mechanics: Seller still profits on the $58 received, but the position shows paper loss vs. simply holding the stock. At $330, seller realizes $58 premium but stock is at $330 — net economic position is equivalent to $388 effective basis vs. delivering at $300+$58=$358
- Note: This is only a "loss" vs. not having written the calls — the premium still reduces effective cost basis
❌ Worst Case for the LEAP Seller — HD Falls Below $300
HD Below $300 by January 2027
- Probability: ~5–7%
- Mechanics: Call expires worthless; seller keeps $58 premium. However, the underlying stock position is worth less than the $300 "strike floor" the seller implicitly assumed
- Drivers: Severe housing market deterioration, tariff escalation beyond current levels, broad market recession, GMS integration failure
- Note: If this is truly a covered call, the seller is protected by the $58 downside buffer to $278.74 effective basis. Below $278.74 is where losses begin on the combined stock + short call position.
💡 Trading Ideas
🛡️ Conservative: "Sell the Near-Term Covered Call Instead"
Strategy: Write HD covered calls at $345 strike, expiring May 2026
- Premium Collected: ~$8–$10 per share ($800–$1,000 per contract)
- Effective Upside Cap: $353–$355 (including premium)
- Max Risk: Long stock exposure below $326–$328 (after premium credit)
- Why This Works: You capture the FOMC/spring season optionality in a shorter window. If HD doesn't reach $345 by May earnings, you keep the premium and can re-write. Lower opportunity cost than selling 10-month LEAP calls.
⚖️ Balanced: "Bullish Risk Reversal — Sell Put, Buy Call"
Strategy: Sell HD $325 put expiring June 2026, Buy HD $360 call expiring June 2026
- Net Credit: ~$1–$3 per spread (approximately neutral cost)
- Effective Range: You're protected below $325 by put premium, and participate above $360
- Why This Works: If you believe the GEX support at $325–$330 holds and the FOMC triggers a rally toward $360, this zero-cost collar-equivalent allows upside participation with defined put-side risk. Relevant given the strong put GEX floor at $325–$330.
🚀 Aggressive: "Buy the $340/$360 Call Spread for FOMC Catalyst"
Strategy: Buy HD $340/$360 call spread, expiring March 20, 2026
- Cost: ~$1.50–$2.50 per spread ($150–$250 per contract)
- Max Profit: $20 per spread ($2,000 per contract) if HD above $360 at Friday close
- Why This Works: Pure FOMC binary bet. If Powell signals June rate cut (market pricing ~45% probability), HD could rally through $340 resistance and approach $350–$360. The spread limits cost to the near-term gamma window. Given Triple Witch on Friday, gamma effects could amplify any directional move.
Risk Warning: This is a 2-day binary trade — time decay is severe and a hold or hawkish FOMC surprise makes this position near-worthless within hours.
⚠️ Risk Factors
For the Deep ITM LEAP Call Seller:
- 📉 Assignment is virtual certainty: At $300 strike with HD at $335+, this call will almost certainly be exercised — the seller must be prepared to deliver 50,000 shares (or buy back the calls) at or before Jan 15, 2027
- 💰 Opportunity cost: If HD rallies to $400 by Jan 2027 on a housing market recovery, the seller has foregone $64/share of upside above $358 effective level
- 📊 Early assignment risk: Deep ITM calls can be exercised early — particularly when the option trades at parity (no time value), dividend capture scenarios, or if the call buyer wants to take delivery of stock. HD's $2.33/quarter dividend should be monitored
For HD Stock:
- 🏠 Mortgage rate stickiness: 30-year rates forecast above 6% through 2026 keeps the housing turnover freeze in place — the core bull thesis (renovation demand from new homeowners) remains elusive
- 🪵 Lumber tariff margin impact: 45% Canadian softwood tariffs and 50% cabinet tariffs are being absorbed rather than passed through — a multi-quarter margin headwind
- 📦 Consumer spending pullback: Comparable sales of +0.3% in FY2025 reflects subdued DIY demand; the Pro strategy through SRS/GMS is promising but integration takes time
- 🏗️ GMS integration execution: $5.5B acquisition must generate tangible cross-selling revenue in 2026 or investor patience wears thin
- 🌦️ Weather risk: Adverse spring weather delays the spring selling season — Q1 comps would disappoint, potentially pressuring HD below $330 gamma support
🎯 The Bottom Line
Here's what matters: A large institutional player sold 500 deep ITM LEAP calls on Home Depot, collecting $58/share ($5.8M gross, $2.9M per the flow record) with an effective delivery price of $358 if exercised. This is a highly calculated, low-drama trade:
- Income generation: $21.26 of pure time value captured on a ~$335 stock = 6.3% in 10-month income, annualizing to ~7.6% — well above HD's 2.7% dividend yield
- Defined exit strategy: If HD is called away at $358 effective, the seller exits a position with a known, satisfactory return — no need to watch tick-by-tick
- Housing market frustration play: The seller may be expressing a view that the housing recovery (and HD's path to $400+) is more than 10 months away — collect income now, revisit the thesis in 2027
What to watch:
- 🏦 FOMC today: A dovish surprise or June rate cut signal could be the catalyst to break $340 resistance — the single most important near-term event for HD
- 📊 $340 gamma wall: The largest GEX concentration in the stack — clearing this level with conviction signals that institutional momentum is returning
- 🌸 Spring selling season (March–June): Home Depot's most critical seasonal window. Q1 comparable sales above +1.5% would signal housing recovery is beginning, potentially pulling forward the bull thesis
⚠️ Disclaimer: This analysis is for informational purposes only and does not constitute financial advice. Options trading involves significant risk of loss and is not suitable for all investors. Past performance does not guarantee future results. Always conduct your own research and consider consulting a financial advisor before making investment decisions.