🤝 INTC $242M "BUY CALL" Headline Is a Trap — This Is a Delta-Neutral Hedged Package, Not a Bull Bet
📅 June 12, 2026 | 🔍 Unusual Activity Detected
✅ Updated 2026-06-15: Next-day OPRA OI confirms the option leg opened — open interest rose 154 → 63,935 (Δ +63,781 ≈ the 63,500 traded). Remember: this is a delta-neutral hedged structure — open ≠ bullish.
🎯 The Quick Take
Someone just crossed $242M worth of deep in-the-money Intel (INTC) call options — and on the surface that reads like one of the largest single-stock bullish bets you'll see all year. But here's the real story: eight seconds later, the same desk shorted 5,000,000 shares of INTC stock at $125.00 on the equity tape. That short stock block nearly perfectly offsets the delta of those calls — leaving the position with almost zero net directional exposure. This is not a $242M bet that INTC goes up. It is a delta-neutral hedged structure, most likely a synthetic long put (put-call parity in action), a financing conversion, or a volatility play. The headline dollar amount is real. The directional conviction is not.
📊 Company Overview
Intel Corporation (INTC) is the world's largest semiconductor company by revenue, designing and manufacturing CPUs, data-center chips, and foundry services:
- Market Cap: ≈$587.8B (as of June 11, 2026)
- Sector / Industry: Information Technology — Semiconductors / Electronic Computers
- What they do: Intel designs x86 CPUs for PCs and servers (Core Ultra / Xeon), runs the Intel Foundry (18A, 14A advanced process nodes), and is executing a multi-year turnaround centered on winning external foundry customers and competing in the AI-accelerator market. The company has attracted strategic equity stakes from the US government, SoftBank, and Nvidia — three endorsements that re-rated the stock ≈+463% over the trailing 12 months.
- Recent performance: After a dramatic re-rating, INTC is trading near $125, just off its 52-week high of $132.75. The stock surged +9.27% on June 11 alone after Bank of America issued a double upgrade to Buy with a $135 price target.
💰 The Option Flow Breakdown
The Tape — June 12, 2026 @ 14:29:12: 🤝 single-leg block cross (negotiated, known counterparty)
| Time | Buy/Sell | Call/Put | Expiration | Premium | Strike | Volume | OI | Size | Spot | Option Price | Option Symbol |
|---|---|---|---|---|---|---|---|---|---|---|---|
| 14:29:12 | BUY | CALL | 2026-09-18 | $242M | $97.5 | 64,000 | 154 | 63,500 | $125.68 | $38.05 | INTC20260918C97.5 |
| 14:29:20 (+8 sec) | SHORT STOCK | — | — | — | — | 5,000,000 shares | — | — | $125.00 | — | INTC equity tape |
Flow type: 🤝 Single-Leg Block Cross — this was a pre-arranged, negotiated block printed off the displayed order book. A broker matched a buyer and a seller with a known counterparty. Not a lit sweep, not urgent buying.
The delta hedge: the Sep $97.5 calls are deep in the money with a delta of ≈0.79. 63,500 contracts × 100 shares × 0.79 delta = ≈5.015 million share-equivalents of long delta. The 5,000,000-share short stock block neutralizes almost exactly that. Net directional exposure: ≈zero.
✅ RESOLVED — Next-Day OI Confirms the Open (2026-06-15)
| Snapshot | Open Interest |
|---|---|
| Pre-print baseline (EOD 2026-06-11) | 154 |
| Resolving (EOD 2026-06-12) | 63,935 |
| Δ | +63,781 (≈ the 63,500 traded) |
Open interest ROSE by 63,781, matching the 63,500 contracts traded — the Sep-2026 $97.5 call leg opened as a fresh position. But "opened" does not mean "bullish": the simultaneous short-stock block (sized to the call delta) neutralizes the directional exposure. The OI check confirms the option position is new on the books; it does not turn a delta-neutral volatility/hedging structure into a directional bet.
🤓 What This Actually Means — Plain English
Let's break this down like a friend at the whiteboard.
The headline trap: When you see "$242M BUY CALL" in an options scanner, your brain lights up — somebody just put a quarter-billion dollars on Intel going up. That's the trap. The call alone is only half the story.
How the math works: A deep ITM call with a 0.79 delta behaves almost like owning stock. You can think of buying 63,500 Sep $97.5 calls like getting "synthetic long exposure" to ≈5.015 million shares of INTC. The desk simultaneously shorted ≈5.0 million real shares of INTC at $125.00. Long ≈5M synthetic shares + short 5M real shares = delta of ≈zero. The position barely moves when INTC moves up or down a few dollars.
So what IS this? There are two classic reasons a sophisticated desk runs this structure:
-
Synthetic long put / financing conversion: By put-call parity, a long deep-ITM call + short stock creates a position economically similar to a long put. The desk is paying ≈$62.7M of time value (the extrinsic premium in the $38.05 option price) to own a kind of insurance against INTC dropping sharply — or to express a volatility view without taking direction risk. This is a textbook conversion structure used by large institutions and prop desks.
-
Carry / balance-sheet financing trade: Buying the call locks in the right to purchase INTC stock at $97.50 for the life of the contract. Combined with the short stock position, a desk can use this structure to cheaply "carry" a large synthetic position, earn or deploy capital, and benefit from any repricing of implied volatility — without betting on direction.
The ≈$62.7M of time value is the key number. The $97.5 call has ≈$28.18 of intrinsic value (INTC at $125.68 minus $97.50 strike) and the remaining ≈$9.87 in the $38.05 price is time/vol premium. Across 63,500 contracts, the desk paid ≈$62.7M for volatility exposure and optionality. That is the real bet — not on the direction of the stock, but on how volatile INTC will be between now and September 18, 2026.
Order type: BTO — Buy to Open the call leg, with a simultaneous short-stock hedge. The overall package is HEDGED / VOLATILITY LONG, not directional bullish. A real bull buys ATM or OTM calls for leverage at low cost — not 0.79-delta calls immediately hedged away with 5 million short shares.
Confidence: HIGH on structure (size ≫ OI, equity hedge confirmed on the tape, delta math is clean). The open/close call is confident — but the directional read is hedged by design.
📈 Technical Setup / Chart Check-Up
YTD Performance
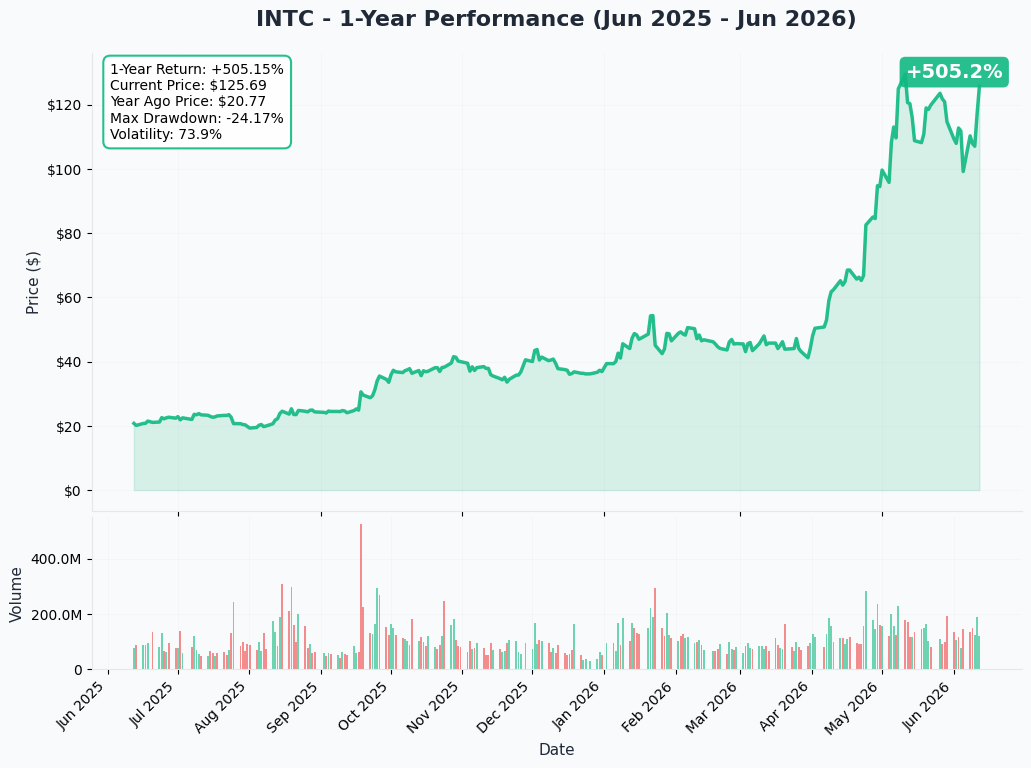
Intel has staged a remarkable comeback from its lows. The stock was trading below $20 just 12 months ago; today it sits at ≈$125 — a +463% trailing-year run driven by the Nvidia $5B strategic investment (announced September 2025), the US government equity conversion, and a SoftBank investment, along with six consecutive earnings beats. The stock is near the top of its 52-week range of $18.97–$132.75.
Key observations:
- 📈 After a +9.27% surge on June 11 driven by the BofA double upgrade to Buy/$135, shares are consolidating just below the 52-week high
- 📊 The run has been extraordinary but also means the stock has already priced in much of the foundry re-rating; a stumble on earnings or a missed foundry milestone could bring a sharp correction
- 🎯 For the hedged structure placed today, the direction of the stock matters less than the level of volatility — the desk profits from a large move in either direction, not specifically from a rally
Gamma-Based Support & Resistance
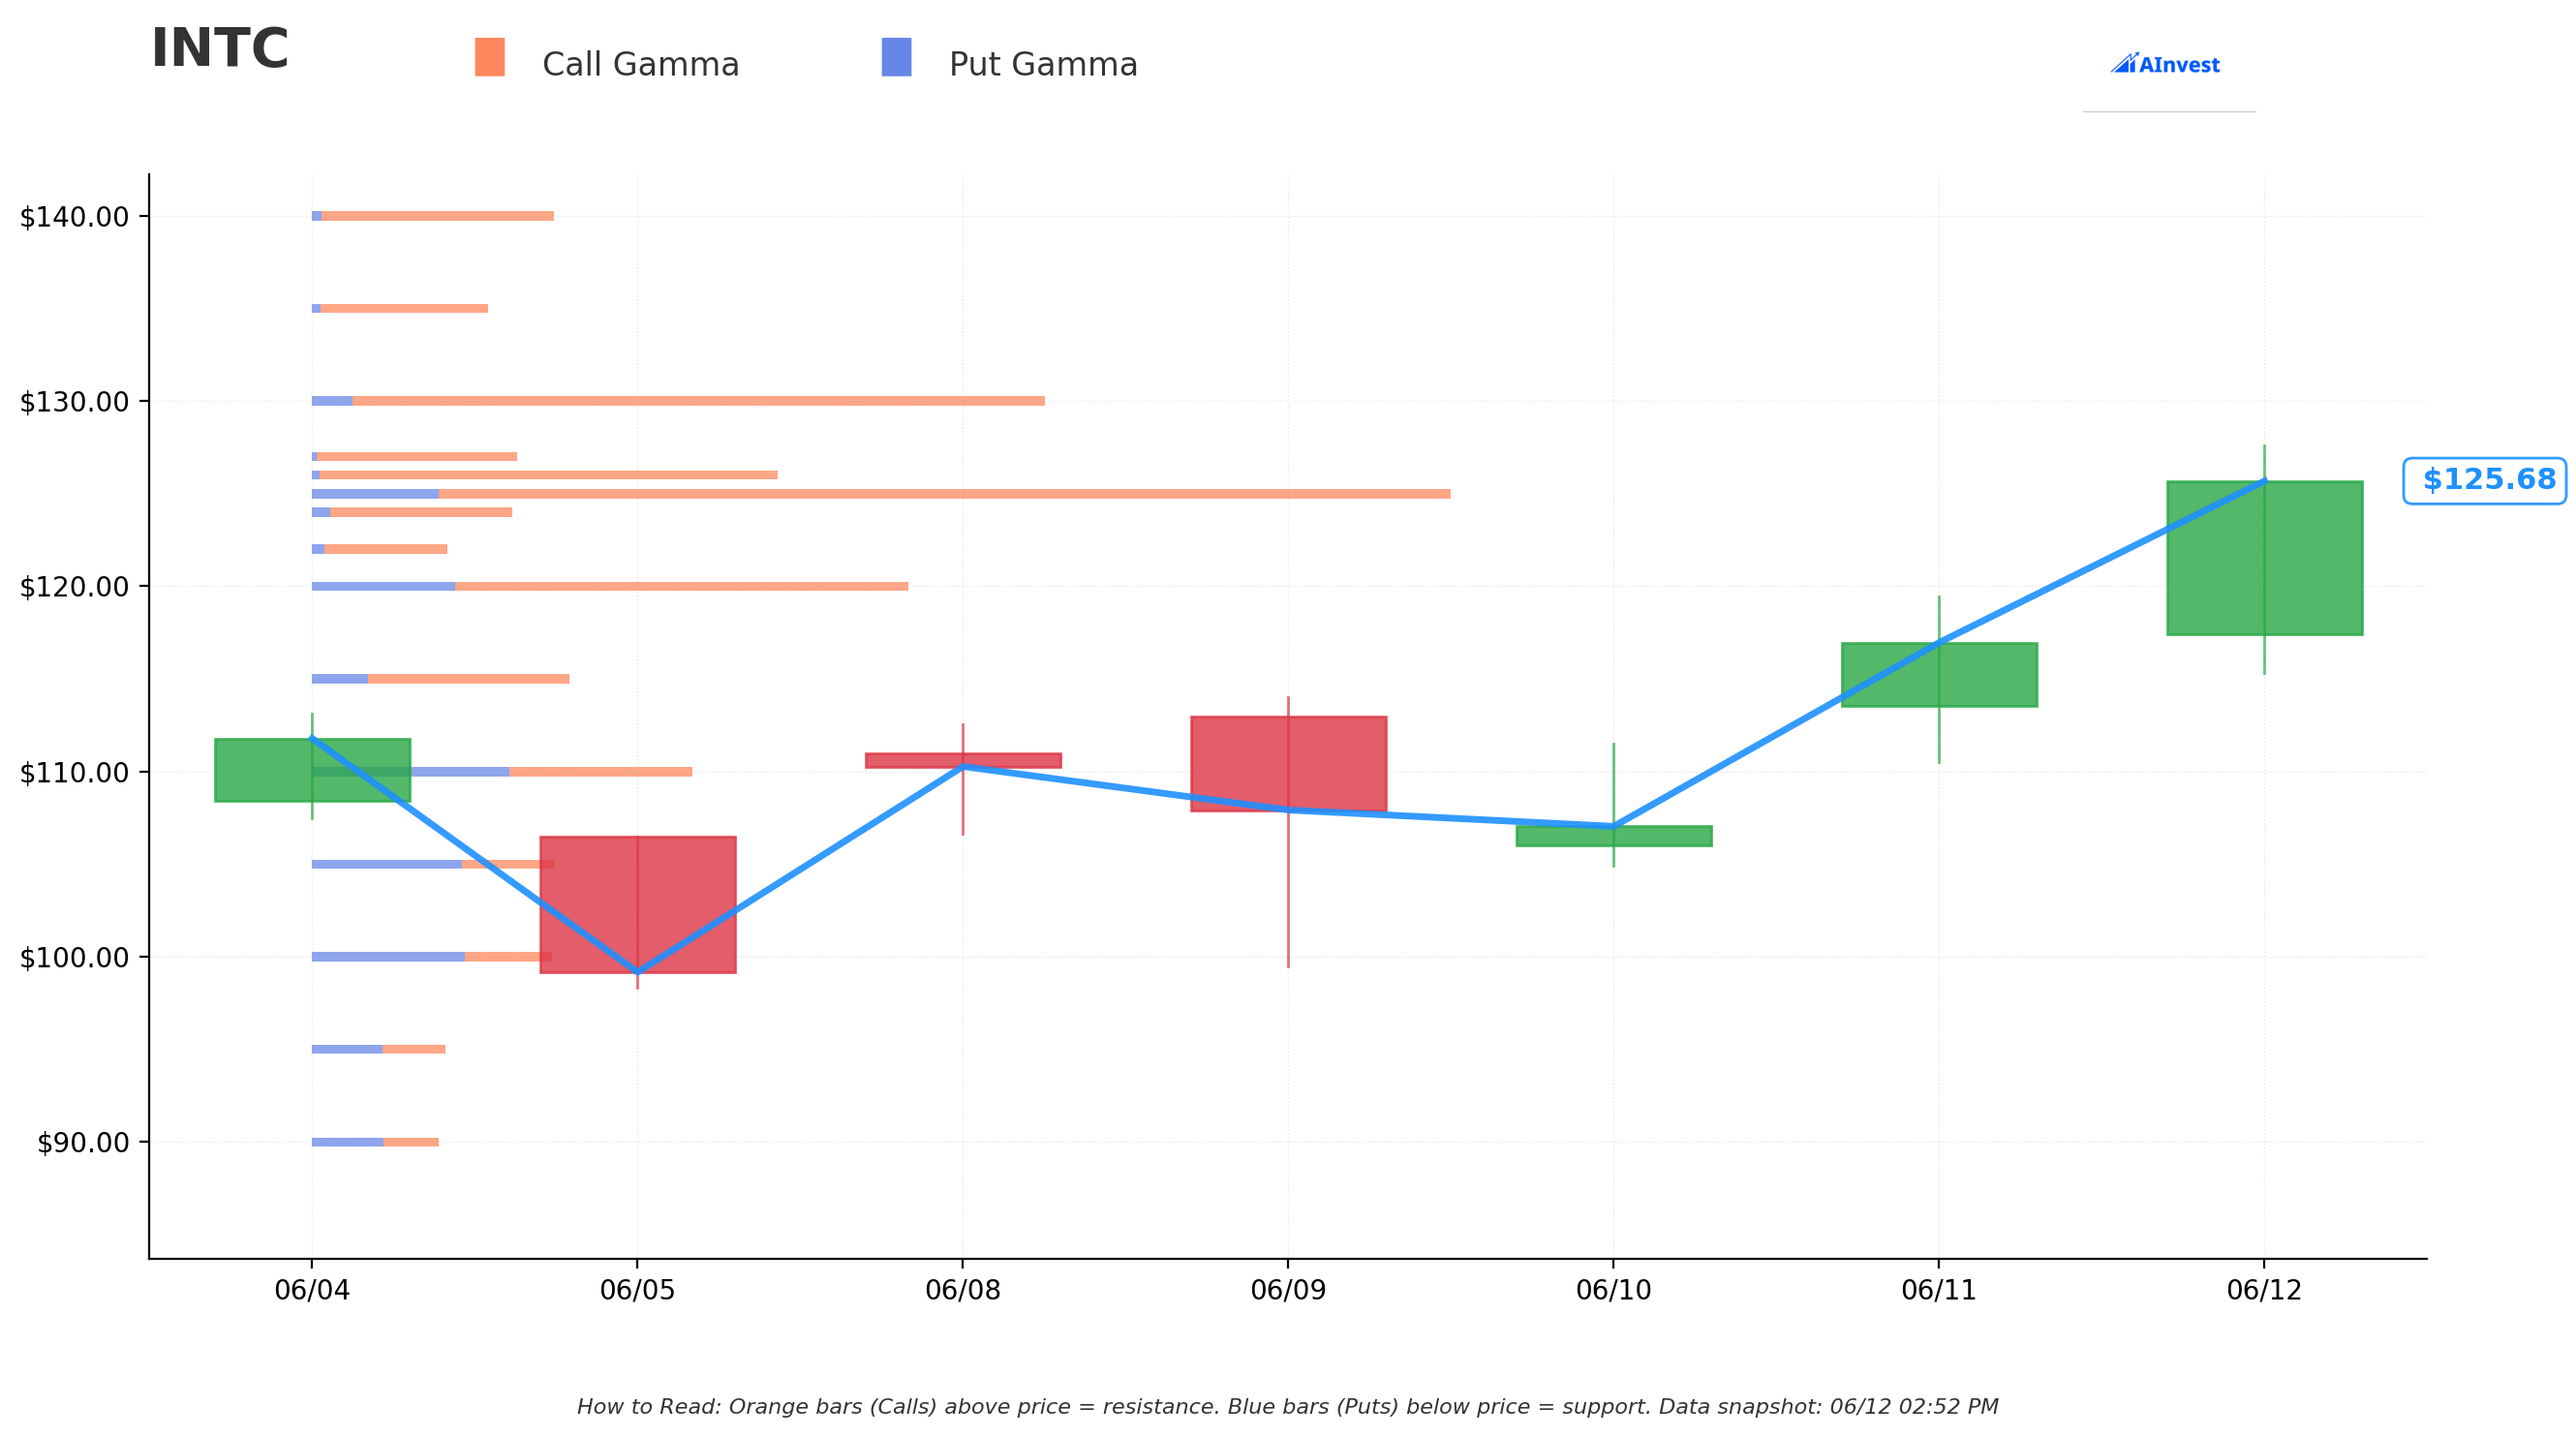
Current Price: ≈$125.39
The gamma exposure map shows a tightly packed field of large positions immediately around the current price:
🔵 Support Levels (Put Gamma Below Price):
- $125.00 — Very Strong Support (dominant gamma wall). This is the single largest gamma cluster in the entire chain — total GEX of 34.96 vs. 13.79 at $126. Market makers are heavily positioned here, and mechanical buying pressure will kick in on dips toward $125. This is the floor the stock has been gravitating toward.
- $120.00 — Very Strong Secondary Support. Total GEX of 17.52 — a second substantial cushion ≈4.3% below spot. A break of $125 would likely find the next meaningful bid at $120.
🟠 Resistance Levels (Call Gamma Above Price):
- $126.00 — Very Strong Immediate Resistance. Just 49 cents above the current price, this is the first gamma wall the stock must clear. Not a large absolute gap, but the density of call gamma here creates mechanical selling from market makers when price approaches.
- $130.00 — Very Strong Key Resistance. Total GEX of 19.57 — the most significant resistance wall above. This is the level to watch for a sustained breakout; a confirmed close above $130 would remove this gamma lid and could accelerate a move toward $135 (BofA's target).
- $135.00 — Strong Resistance at the BofA Target. Total GEX of 5.11 — lighter than $130, but notable because it coincides with the BofA $135 price target.
Translation for traders: INTC is currently "parked" between the $125 gamma support floor and the $126/$130 resistance ceiling. It's pinned tightly. For the hedged structure on the tape today, gamma levels don't change the delta-neutral thesis — but they're relevant context for anyone trading INTC directionally.
Implied Move Analysis
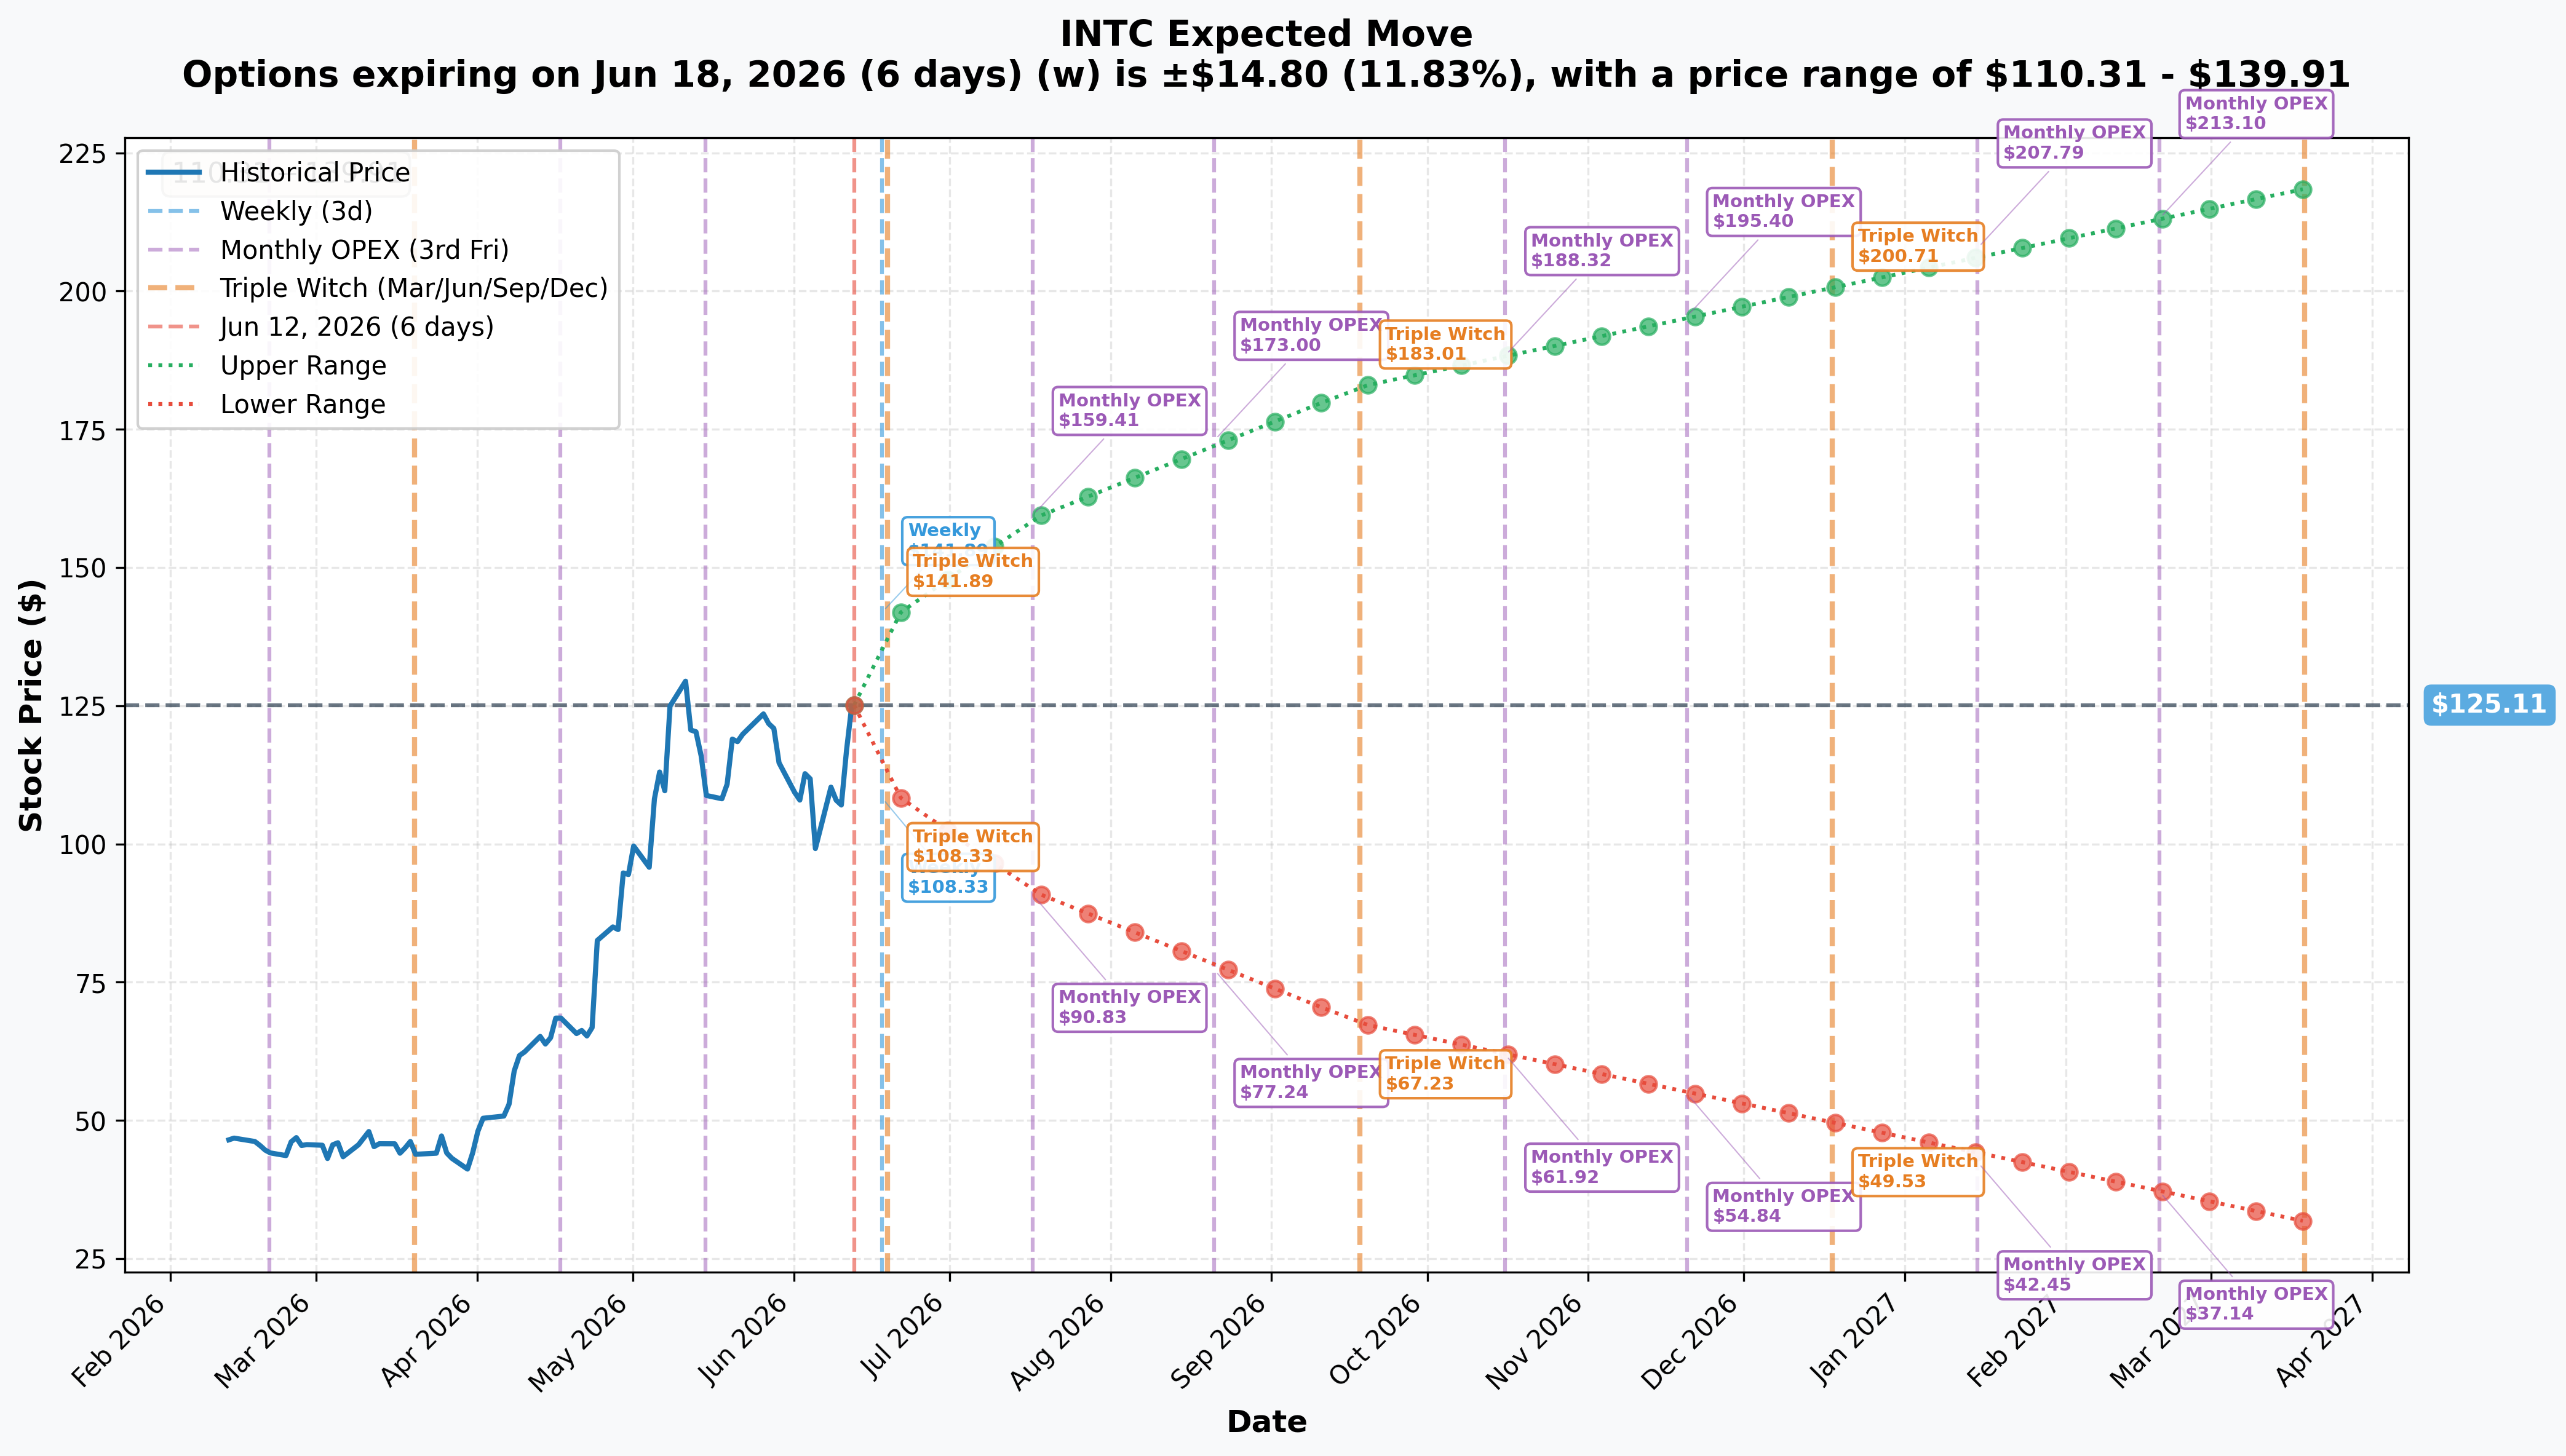
The options market is pricing enormous uncertainty across time horizons — which is exactly why a volatility structure like today's trade makes sense:
- 📅 Weekly (exp 2026-06-18, 6 days): ±$14.80 (±11.83%) → Range $110.31 – $139.91
- 📅 Monthly OPEX (exp 2026-07-17, 35 days): ±$33.91 (±27.1%) → Range $91.21 – $159.03
- 📅 Quarterly (exp 2026-09-18, 98 days — the trade's expiry): ±$57.69 (±46.11%) → Range $67.43 – $182.81
- 📅 LEAP (exp 2027-03-19, 280 days): ±$93.49 (±74.72%) → Range $31.63 – $218.61
The September 18 expiry range of $67.43 – $182.81 is particularly striking. After a ≈463% run, the options market is pricing nearly a 50% move in either direction by the time the Sep $97.5 calls expire. That kind of implied volatility is expensive — and it's exactly what a volatility buyer (paying ≈$62.7M in time premium) is positioning to capture if realized volatility delivers. The $97.50 strike sits ≈22% below current spot; the options market's own probability cone by September includes a scenario where INTC revisits that level.
🎪 Catalysts
Already Happened (Recent Context)
Q1 2026 Earnings — Beat on Revenue and EPS (Reported April 23, 2026) Revenue $13.6B, up 7% YoY, beating the ≈$12.32B consensus by ≈$1.4B — Intel's sixth consecutive quarter exceeding the high end of guidance. Data Center & AI (DCAI) revenue surged +22% YoY. Non-GAAP EPS $0.29 (more than double the prior year $0.13). The catch: GAAP net loss of $3.7B from $4.1B in restructuring and Mobileye goodwill charges — the turnaround is still burning cash at the GAAP level.
The Strategic Equity Trifecta That Re-Rated Intel
- US Government converted ≈$8.9B in CHIPS Act grants into 433.3M shares of Intel equity, giving the stock a strategic-asset backing it didn't have before.
- SoftBank invested $2.0B in common stock (August 2025).
- Nvidia invested $5.0B at $23.28/share (December 2025) — Intel's stock surged 22% in a single day on the announcement, its best single-day move in nearly 38 years. The Nvidia deal is also strategic: Intel will design/manufacture custom x86 CPUs for Nvidia data centers linked via NVLink, and co-develop "Intel x86 RTX SoCs" for PCs. These products are ≈2 years out (2027–2028).
18A Foundry Yields Improving — Intel CEO Embraces External Customers 18A yields have been improving ≈7% per month for 7–8 months, and CEO Lip-Bu Tan has now positioned 18A for external customers, with "inbound interest" in 18A-P. Disclosed deals include Microsoft, MediaTek, and Broadcom; 20+ foundry agreements worth >$15B lifetime value.
Panther Lake Launch — First 18A AI PC Platform (CES 2026) Intel launched Panther Lake (Core Ultra Series 3) at CES 2026 with 200+ system designs in development and ≈60% better multi-threaded performance vs Lunar Lake — the first proof-of-concept for 18A in a shipping product.
BofA Double Upgrade — June 11, 2026 Bank of America raised to Buy with a $135 target, modeling products revenue rising from ≈$55B (2026) to $86.1B by 2030 and foundry revenue from ≈$1.1B (2026) to $47.1B by 2030. The upgrade triggered INTC's +9.27% move on June 11.
Upcoming Catalysts (The Key Events Through September)
Q2 2026 Earnings — July 23, 2026 (after close) — THE PRIMARY EVENT 📅 Confirmed date per TipRanks. Company guidance: revenue $13.8–$14.8B, non-GAAP EPS ≈$0.20, gross margin ≈39%. This report lands before the Sep $97.5 calls expire — making it the single largest volatility event embedded in the delta-neutral structure. Watch: DCAI growth rate, foundry operating-loss trajectory, external foundry revenue ramp (currently just $174M/quarter), and any new 18A/14A customer names.
External 14A/18A Customer Commitments — H2 2026 Intel expects customers to make 14A decisions in H2 2026 into H1 2027, with commitments delivered in H2 2026. If Apple or Amazon formalize deals (currently reported but no agreement announced), the stock could re-rate further. A miss here is a downside risk.
Nova Lake Desktop CPU Launch — Late 2026 Intel promises "leadership across the board on desktop" with Nova Lake competing head-to-head against AMD Zen 6. Nova Lake is confirmed on-track.
Jaguar Shores AI Accelerator Intel cancelled Gaudi/Falcon Shores and pivoted to a rack-scale Jaguar Shores design using HBM4 — its re-entry into the AI GPU market. This is a longer-dated catalyst with no confirmed launch date. Intel's AI GPU franchise was effectively gutted when it exited Gaudi; Jaguar Shores is the rebuilding attempt.
🎲 4-Reader Interpretation
🚀 YOLO Trader
Before you get excited about "a $242M call buy" — read the full setup. The delta is hedged away. This desk is not betting INTC rips higher. They're positioned for volatility — not direction. If you want to piggyback on the vol theme, consider buying a straddle on INTC ahead of the July 23 earnings (buy both a call and a put at the same strike). A big move either way pays off. The options market is pricing ±27% by monthly expiry and ±46% by September — with that kind of implied move, an ATM straddle around $125 will be expensive, but the catalyst density (earnings July 23, foundry announcements) supports it. Max loss: the combined premium. Don't bet directional based on this cross.
📊 Swing Trader
The gamma map tells the short-term story. INTC is parked between $125 gamma support and $126/$130 resistance. A breakout above $130 on strong July-23 earnings would be technically clean — targeting $135 (the BofA price target). Conversely, if Q2 guidance disappoints, the $125 support breaks and $120 is the next meaningful level. For a swing setup: watch the $130 level as the bull/bear line of control. A confirmed close above $130 + earnings beat = long thesis intact. A break below $125 on volume = the run has stalled, look for $120 as the next test.
🛡️ Premium Collector
With implied volatility this elevated (the options market is pricing ±46% over the next 98 days), premium collection strategies look attractive if you have a neutral-to-slightly-bullish view. A covered call at the $130–$135 strike on existing stock positions would collect rich premium while capping upside at levels analysts already consider fair value. Alternatively, a cash-secured put at the $115–$120 support zone offers a defined-risk income strategy. Caveat: the July 23 earnings spike will widen bid/ask spreads and could hurt you if vol collapses after the report — close premium positions before earnings or size them for a binary outcome.
🌱 Entry-Level / Beginner
Here's the plain-English version of what happened today. Somebody bought $242 million worth of call options on Intel stock — but at the same time they sold 5,000,000 shares of Intel stock. Those two actions cancel each other out. When you buy a call (which goes up if stock goes up) AND sell the stock (which profits if stock goes down), your position barely moves no matter which way Intel goes. The fancy term for this is "delta neutral" — the deltas cancel. The desk isn't betting on a direction. They're paying ≈$62.7 million in option time-premium to potentially profit from Intel being volatile — moving a lot in either direction — between now and September. Think of it as buying insurance or placing a bet on turbulence, not on which way the plane is flying.
⚠️ Risk Factors
Options trading involves substantial risk of loss and is not suitable for all investors.
The $242M structure is a volatility/hedging trade — the OPRA tape confirms direction is neutral We have high confidence the delta-neutral read is correct: the tape shows the call cross + an equity short block ≈8 seconds later that sizes exactly to the call delta. But we cannot access the buyer's full portfolio — if they already held a large pre-existing short in Intel, the equity tape print could be a partial hedge, not a full one. The OPRA tape confirms mechanism and size; it does not confirm the buyer's net book across all positions.
The foundry thesis is still unproven at scale Intel's foundry strategy has never been executed at this scale. External foundry revenue is still just $174M/quarter vs. a long-term ambition of tens of billions. CHIPS Act disbursements are milestone-contingent — missed construction or production targets could delay funding.
≈$5.5B annual free-cash-flow burn Intel is burning ≈$5.5B annually with ≈$8.5B in cash. The foundry build-out implies 2–3 more years of burn, raising the prospect of further equity dilution that would weigh on per-share value.
GAAP profitability still negative Q1 2026 showed a $3.7B GAAP net loss from $4.1B in restructuring and impairment. The non-GAAP numbers look better, but GAAP losses confirm the turnaround is not yet complete.
Valuation / momentum risk after a ≈463% run After one of the most dramatic large-cap re-ratings in recent memory, INTC is trading near its 52-week high and well above most published consensus price targets (many of which are stale at $77–$91). Any earnings stumble or foundry-commitment miss on July 23 could trigger a sharp drawdown from elevated levels. High implied volatility in both directions reflects this risk.
AI accelerator franchise remains weak Intel cancelled Gaudi and Falcon Shores, ceding near-term AI GPU revenue to Nvidia and AMD. Jaguar Shores is a strategic reset with no confirmed timeline. Intel is a distant third in AI accelerators.
Analyst consensus is mixed Despite the BofA upgrade, the broader consensus is ≈20 Buy / 52 Hold / 6 Sell — a 72% neutral-to-bearish reading from the sell side even at current prices. The stock has run far faster than analyst model updates.
What the OPRA tape CANNOT prove: We see the mechanism (block cross), size (63,500 contracts), price ($38.05), and the equity hedge (5M shares short at $125). We cannot identify the buyer, their existing portfolio, their hedge ratio across the full book, their stop-out level, or their precise P&L targets. We interpret the tape; we don't read minds. The delta-neutral read is the most probable interpretation, not a certainty.
🎯 The Bottom Line
Here's the deal: the $242M number is real, but the directional story it implies is not.
Real talk: a sophisticated desk structured a delta-neutral package — buying ≈$242M of deep ITM Sep $97.5 calls while simultaneously shorting 5 million shares of INTC stock. The call buy + the stock short is a textbook hedged conversion: close to zero net exposure to whether INTC goes up or down. The ≈$62.7M of time value paid is the real bet — on elevated implied volatility and/or as a financing/synthetic-put structure.
For directional traders, the most important fact is this: do not read this trade as a $242M conviction long on Intel. A real bull buys ATM or OTM calls for leverage — not 0.79-delta calls that are immediately hedged with a 5M share short. If you want a directional view, form it independently based on Intel's own fundamentals.
The macro setup is genuinely interesting — just two-sided. Intel has real momentum (six straight earnings beats, Nvidia/SoftBank/US government backing, 18A yield improvement at ≈7%/month, and a fresh BofA $135 Buy), but also real risks (≈$5.5B cash burn, unproven foundry at scale, gutted AI GPU franchise, stock already up ≈463% YTD). That two-sided uncertainty — and the high implied volatility it generates — is exactly the environment a delta-neutral volatility structure is designed to exploit.
What to watch:
- 📅 July 23, 2026: Q2 2026 earnings after close — the biggest volatility trigger before Sep $97.5 expiry. Watch DCAI trajectory, foundry operating-loss trend, and any new external 18A/14A customer commitments.
- 📅 H2 2026: 14A/18A foundry customer commitment window — Apple/Amazon deals would be a step-change re-rating event.
- 📅 Late 2026: Nova Lake desktop CPU launch — Intel's proof point on the client franchise.
- 📅 September 18, 2026: Sep $97.5 calls expiry — the implied move range is $67.43 – $182.81.
- 📅 Tomorrow ≈06:30 ET: OPRA OI snapshot — expected to show INTC Sep-2026 $97.5C OI rising to ≈63,500 (from prior 154), confirming the option leg opened. Remember: open ≠ bullish here.
Key gamma levels to watch if you're trading directionally: $125 support (very strong), $120 secondary support. $126 immediate resistance, $130 key resistance wall, $135 BofA target zone.
Disclaimer: Options trading involves substantial risk of loss and is not suitable for all investors. This analysis is for educational and informational purposes only and does not constitute financial advice or a recommendation to buy or sell any security. The trade described is interpreted as a delta-neutral hedged structure based on available OPRA tape evidence; this interpretation may not reflect the full intent of the parties involved. Past unusual options activity does not guarantee future returns. The INTC September 2026 $97.5 calls described herein are deep in the money and were traded as part of a simultaneously hedged package; standalone analysis of the call position without considering the equity hedge would be materially misleading. Always conduct your own due diligence and consider consulting a licensed financial advisor before making any trading decisions. Open/close classification is based on size-vs-prior-OI inference and will be confirmed by next-day OPRA open interest data (≈06:30 ET).
Last updated: June 12, 2026
Last updated: 2026-06-15 — next-day OPRA OI resolved the open (option leg OPEN confirmed; structure remains delta-neutral, not directional).