🐋 MSFT Mixed Signal — $22M Downside Put + ≈$13M Bull Call Spread Hit the Tape the Same Day
📅 June 12, 2026 | 🔥 Unusual Options Activity Detected
✅ Updated 2026-06-15: Next-day OPRA OI confirms the structure opened — $450C rose to 30,044 (Δ +18,429, vs a corrected prior OI of 11,615 — the earlier "OI 2" was a bad feed value), $530C rose 5,637 → 22,891 (Δ +17,254, STO confirmed), and the $420P block opened net +3,770 (4,362 → 8,132). All legs confirmed on the books.
🎯 The Quick Take
Two very different desks just showed up in Microsoft's options tape today — and they're pointing in opposite directions. Early this morning a desk executed a bull call spread for ≈$12.8M net debit, targeting a run to $530 by September. Hours later, a separate desk crossed a $22M block in deep-ITM $420 puts, loading up on downside protection before August. The same stock, two hard-money views, one session. The options market is genuinely divided on Microsoft right now — and with Q4 FY2026 earnings on July 28 sitting inside both windows, today's flow is a live argument about which direction that print sends the stock.
📊 Company Overview
Microsoft Corporation (NASDAQ: MSFT) is a ≈$2.88 trillion mega-cap technology company in the Information Technology / Software-Infrastructure sector.
- Market Cap: ≈$2.88 trillion
- Current Price: ≈$388.22 (intraday June 12, 2026; spot at the time of the put cross)
- Sector: Technology — Software & Infrastructure (SIC: Prepackaged Software)
- Core Business: Microsoft's three segments are Intelligent Cloud (Azure, GitHub, server products), Productivity & Business Processes (Microsoft 365, Copilot, LinkedIn, Dynamics), and More Personal Computing (Windows, Xbox, Surface). Azure is the central growth engine. The stock is down ≈14% YTD — punished despite blowout Q3 FY2026 numbers (revenue +18% YoY, Azure +40%) because management disclosed a ≈$190 billion full-year capex plan — ≈23% above Street estimates, stoking a "capex payback" debate that has kept MSFT in the $370–$420 range for weeks.
💰 The Option Flow Breakdown
📊 What Just Happened
Today produced two distinct, unrelated structures that need to be read separately. The first — a bull call spread via multi-leg auction — printed at 09:42:19 ET. The second — a single-leg ITM put block cross — hit at 13:15:34 ET. Together they are four rows on the tape, two completely different theses.
| Time | Buy/Sell | Type | Strike | Expiration | Volume | OI | Size | Premium | Spot | Option Price | Option Symbol |
|---|---|---|---|---|---|---|---|---|---|---|---|
| 13:15:34 | BUY | PUT 🤝 | $420 | 2026-08-21 | 5,000 | 4,400 | 5,000 | $22M | $388.22 | $43.70 | MSFT20260821P420 |
| 09:42:19 | BUY | CALL | $450 | 2026-09-18 | 15,000 | 2 | 14,542 | $15M | $383.67 | $10.20 | MSFT20260918C450 |
| 09:42:19 | SELL | CALL | $530 | 2026-09-18 | 15,000 | 5,600 | 14,542 | $4.1M | $383.67 | $2.84 | MSFT20260918C530 |
| 09:42:19 | BUY | CALL | $450 | 2026-09-18 | 16,000 | 2 | 1,832 | $1.9M | $383.67 | $10.20 | MSFT20260918C450 |
Mechanism tags:
- 🤝 $420 Put (13:15:34): Single-leg block cross — a pre-arranged, negotiated block between a known buyer and seller off the open book. Not a lit sweep. Not an auction. The $22M was agreed before the print hit the tape.
- $450/$530 Calls (09:42:19): Multi-leg auction — a facilitated exchange price-improvement auction on a complex two-leg spread. This is a worked complex order, not a directional lit sweep and not a cross.
Net premiums:
- 🐻 ITM Put block cross: $43.70 × 5,000 contracts × 100 = $22M gross (single leg, buyer paid full premium)
- 🐂 Bull call spread (net): ($10.20 − $2.84) × 16,374 avg contracts × 100 ≈ ≈$12.8M net debit (long $450 calls funded partly by short $530 calls)
✅ RESOLVED — Next-Day OI Confirms the Structure Opened (2026-06-15)
| Leg | Pre-print baseline (EOD 2026-06-11) | Resolving (EOD 2026-06-12) | Δ | Verdict |
|---|---|---|---|---|
| Sep-18 $450C (BUY) | 11,615 | 30,044 | +18,429 (≥ the 16,374 traded) | OPEN — BTO confirmed |
| Sep-18 $530C (SELL) | 5,637 | 22,891 | +17,254 (> the 14,542 traded) | OPEN — STO confirmed |
| Aug-21 $420P (BUY block) | 4,362 | 8,132 | +3,770 (net new; ≈1,230 was transfer) | OPEN — net new long put |
All legs opened. One correction worth noting: the original write-up read the $450C prior OI as "2 contracts" from the screenshot feed — that was a bad feed value. The true prior open interest (EOD 2026-06-11) was 11,615, and the next-day snapshot rose to 30,044, a gain of +18,429 that exceeds the 16,374 contracts traded — so the long call leg is confirmed opened regardless. The $530C short call opened fresh (STO, OI well above size), and the $420P block added ≈3,770 net new long puts (the balance of the 5,000-lot print offset existing holders — a partial transfer). The bull-call-spread-plus-protective-put structure is confirmed on the books.
🤓 What This Actually Means — Plain English
Two desks. Two very different views. Let's decode each.
🐂 Structure A: The Bull Call Spread (multi-leg auction, 09:42:19)
A bull call spread is how a trader says: "I think this stock is going up — but I don't want to pay full price for the right to participate."
Here's how it works on MSFT:
- 🟠 BUY the $450 Call — pay $10.20 per share. You have the right to "buy" MSFT at $450 through September 18. If MSFT runs to $530, you profit on every dollar above $450.
- 🔵 SELL the $530 Call — collect $2.84 per share. You give up gains above $530, but the $2.84 collected offsets some of what you paid for the $450 call.
- 💰 Net cost: ≈$7.36 per share (the $10.20 paid minus $2.84 collected), or ≈$12.8M total. That's the most you can lose on the spread.
The full payoff picture:
| Scenario at Sep 18 expiry | What happens | P&L |
|---|---|---|
| MSFT below $450 | Both calls expire worthless | −$12.8M (full debit lost) |
| MSFT between $450–$457.36 | Partial recovery of cost | Breakeven at ≈$457.36 |
| MSFT at $530 or above | Maximum spread value realized | +$118.2M ($80 spread width × 16,374 × 100 − $12.8M) |
- Max loss: ≈$12.8M (at or below $450 — MSFT fails to move)
- Breakeven: ≈$457.36 (the $450 long strike + ≈$7.36 net debit)
- Max profit: ≈$118.2M (at or above $530 — full $80 width captured)
- Risk/Reward: roughly 1:9.2 — the desk is risking $12.8M to potentially make $118.2M if MSFT reaches $530 by September
Translation for regular folks: This is a desk saying "Microsoft is down ≈14% this year and is oversold. Azure just grew 40%, the AI run-rate is above $37 billion, and the stock is sitting ≈26% below its highs. We want exposure to a recovery into autumn — but we don't want to bet the whole $22M on an outright call. We'll buy the right to participate from $450 to $530, cap our upside there, and pay ≈$12.8M for that window." It's a measured, structured bullish bet on a rebound, not a YOLO lottery ticket.
The target: $530 by September 18 implies ≈37% above today's ≈$388 price — a meaningful move, but one that requires the July 28 Q4 earnings to deliver a clean beat and credible FY2027 capex narrative.
🐻 Structure B: The ITM Put Block Cross (block cross, 13:15:34)
A separate desk, hours later, took a very different view. They crossed 5,000 $420 puts — deep in-the-money with MSFT at ≈$388, paying $43.70 per contract ($4,370 per lot, $22M total) for the right to "sell" MSFT at $420 through August 21.
Why pay a premium for something already in-the-money? Because the $420 put is intrinsically worth ≈$31.78 already (the difference between the $420 strike and the ≈$388.22 spot), and the extra ≈$11.92 above intrinsic reflects time value and downside vol premium. This desk is essentially paying up for accelerated downside protection — or taking a leveraged bearish bet on MSFT falling further below $420 before August.
Key characteristics:
- 🤝 This was a block cross — a pre-arranged negotiated trade with a known counterparty off the lit book. There's no "panic sweep" dynamic here. A desk called a broker, agreed on price with a willing seller, and the cross printed on-exchange. The urgency narrative that works for lit sweeps does not apply to crosses.
- 📉 With MSFT at $388.22, the $420 put is already $31.78 in-the-money. To reach full value at expiry, MSFT just needs to stay below $420 — it doesn't need to fall further. But the maximum profit potential grows as the stock falls.
- 💡 Breakeven for the put buyer: $420 − $43.70 = $376.30 — MSFT needs to be at or below ≈$376.30 at August 21 expiry for the position to break even on cost.
What the $22M ITM put could mean:
- Outright bearish bet: The desk thinks the Q4 earnings print on July 28 — which lands squarely before the August 21 expiry — could send the stock lower, possibly on another capex surprise or a guidance miss.
- Hedge against an existing MSFT long: A desk holding a large long MSFT position might buy ITM puts to lock in the floor value of their book ahead of the binary earnings event. In this case, the $22M is insurance cost, not a directional conviction trade.
- Partial close of a prior position: With OI at 4,400 prior to today's 5,000-lot print, the size is slightly above prior OI — but not so far above that we can definitively rule out that some of today's volume is closing an existing long-put position from a prior date. The next-day OI will tell us.
⚠️ The OPRA tape cannot tell us which of these three it is. It shows us a $22M ITM put block cross with defined economics. Whether it's a hedge or a directional bet, or partially a close — that resolution comes next-day.
🔀 The Mixed Signal — What Does It Mean Together?
These two structures are almost certainly from two completely different desks with two completely different theses. The bull call spread (morning, $12.8M net debit) is unambiguously bullish — it only makes money if MSFT rallies significantly through September. The ITM put cross (afternoon, $22M) is bearish-to-protective, profitable if the stock stays below $376.30 at August expiry.
The honest read: institutional money is genuinely split on Microsoft right now. The bull case (Azure compounding at 40%, $228B OpenAI stake, cheap vs. history at ≈26% off highs) and the bear case (≈$190B capex overhang, FTC probe, Xbox restructuring, margin compression) are each finding real money behind them on the same day.
📈 Technical Setup / Chart Check-Up
YTD Performance
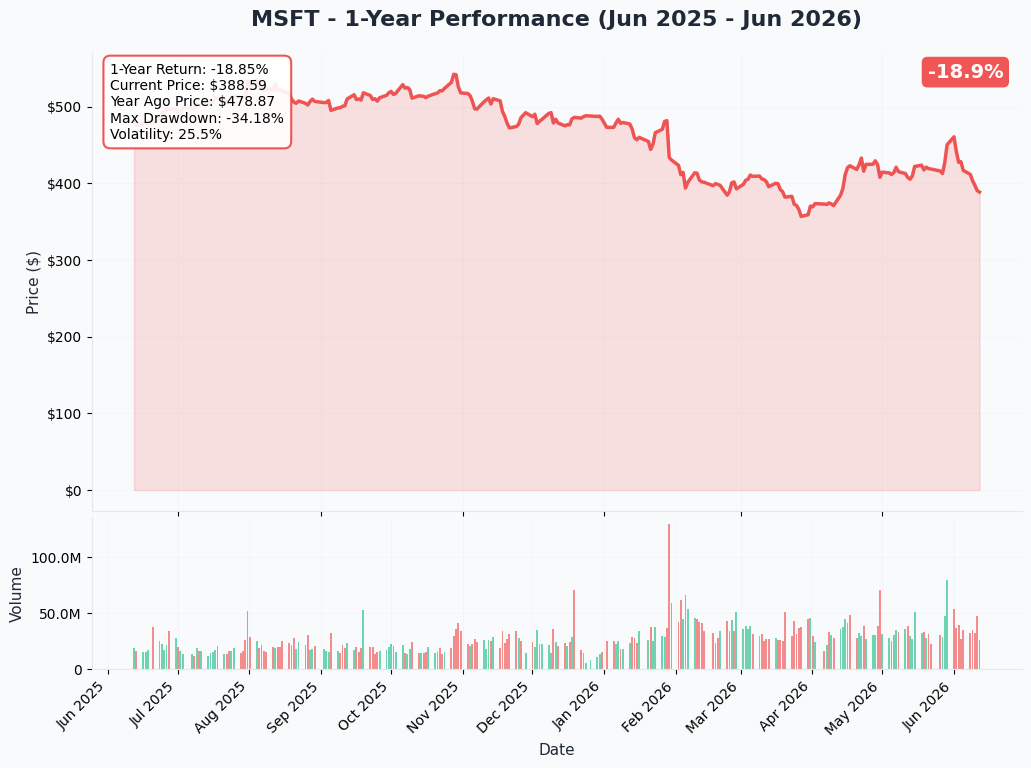
Microsoft has had a rough 2026. After peaking near $555 in October 2025, the stock fell ≈26% to a 52-week low before staging a modest recovery. For the year, MSFT is down ≈14% — a significant de-rating for a mega-cap that just posted revenue +18% YoY and Azure +40%. The market's verdict is clear: the ≈$190B capex plan is the dominant overhang, and until AI revenue scales to justify it, the multiple stays compressed. The stock has been grinding in a ≈$370–$420 band since the April 29 Q3 earnings-day drop.
Key observations:
- 📉 ≈14% YTD performance; ≈26% below the October 2025 all-time high
- 🔄 Sideways consolidation in the ≈$370–$420 range for most of April–June
- 📊 The $390 area has repeatedly acted as short-term support; rallies stall near $415–$420
- ⚠️ The bull call spread's $450 breakeven is ≈17% above today's price; the put's $376.30 breakeven is ≈3% below
Gamma-Based Support & Resistance
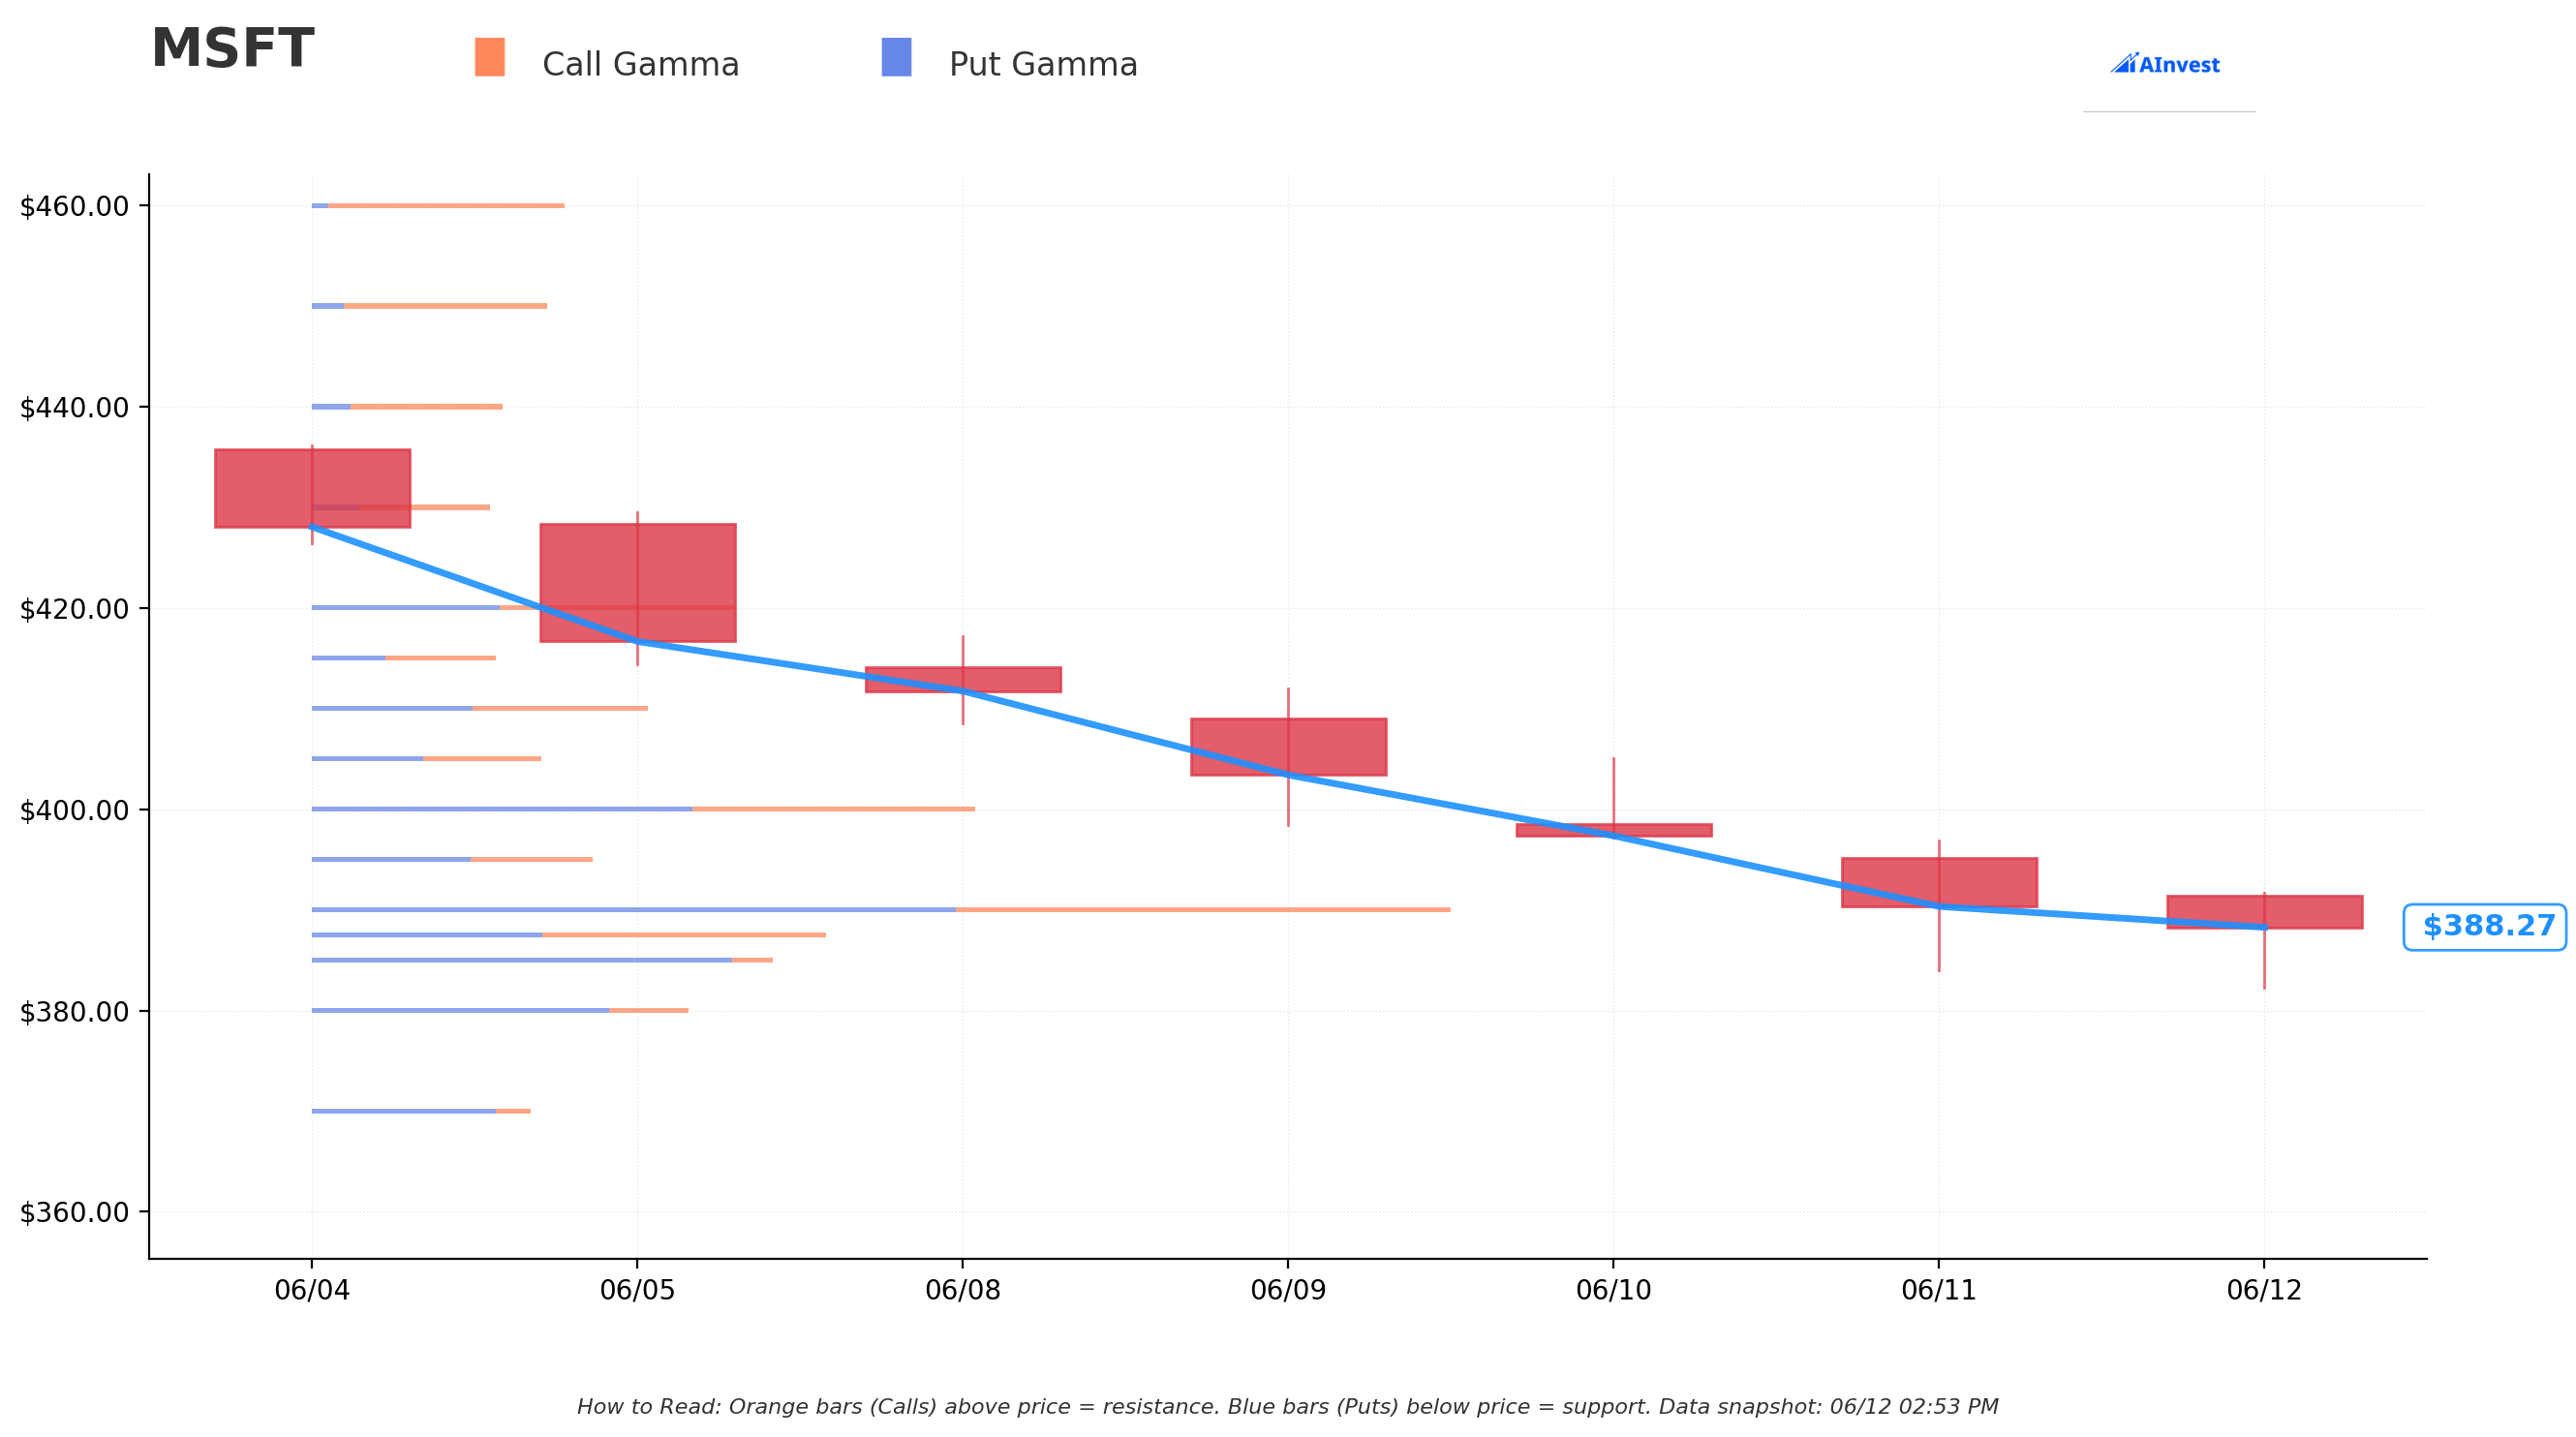
With MSFT near ≈$389, the gamma exposure map shows a market-maker-governed corridor that explains today's range-bound behavior. The picture gives context for exactly where both structures today are anchored.
🔵 Key Support Levels (Put Gamma — market makers buy dips to hedge):
- $387.50 — Strong near-term gamma floor; first line of defense on any pullback from current levels
- $385.00 — Secondary support; a close below here would signal the floor is cracking
- $380.00 — Very strong gamma wall; the $380 zone has consistently absorbed selling pressure — a break below would open space toward the bear case quickly
🟠 Key Resistance Levels (Call Gamma — market makers sell rallies to hedge):
- $390.00 — Immediate overhead resistance right at the current price; the market keeps bumping into this wall
- $400.00 — Strong resistance; clearing $400 convincingly would signal real momentum returning
- $420.00 — Major resistance ceiling — and critically, this is also the $420 put strike. The put buyer is betting that gamma resistance at $420 is the ceiling; the call spread buyer is betting that ceiling eventually breaks. This is the exact level where both theses collide.
- $450.00 — The bull call spread's long strike sits in open air above the $420 gamma wall; getting there requires a clean break through three layers of resistance
What this means for both structures: The gamma data frames today's trades with precision. The $420 put sits right at the top of the gamma resistance band — the put buyer is pricing in that this ceiling holds and MSFT falls back toward $380 or lower. The call spread's $450/$530 targets require a clean breakout above all current resistance levels — a move that would take either multiple sessions of momentum or a single strong catalyst (July 28 earnings).
Implied Move Analysis
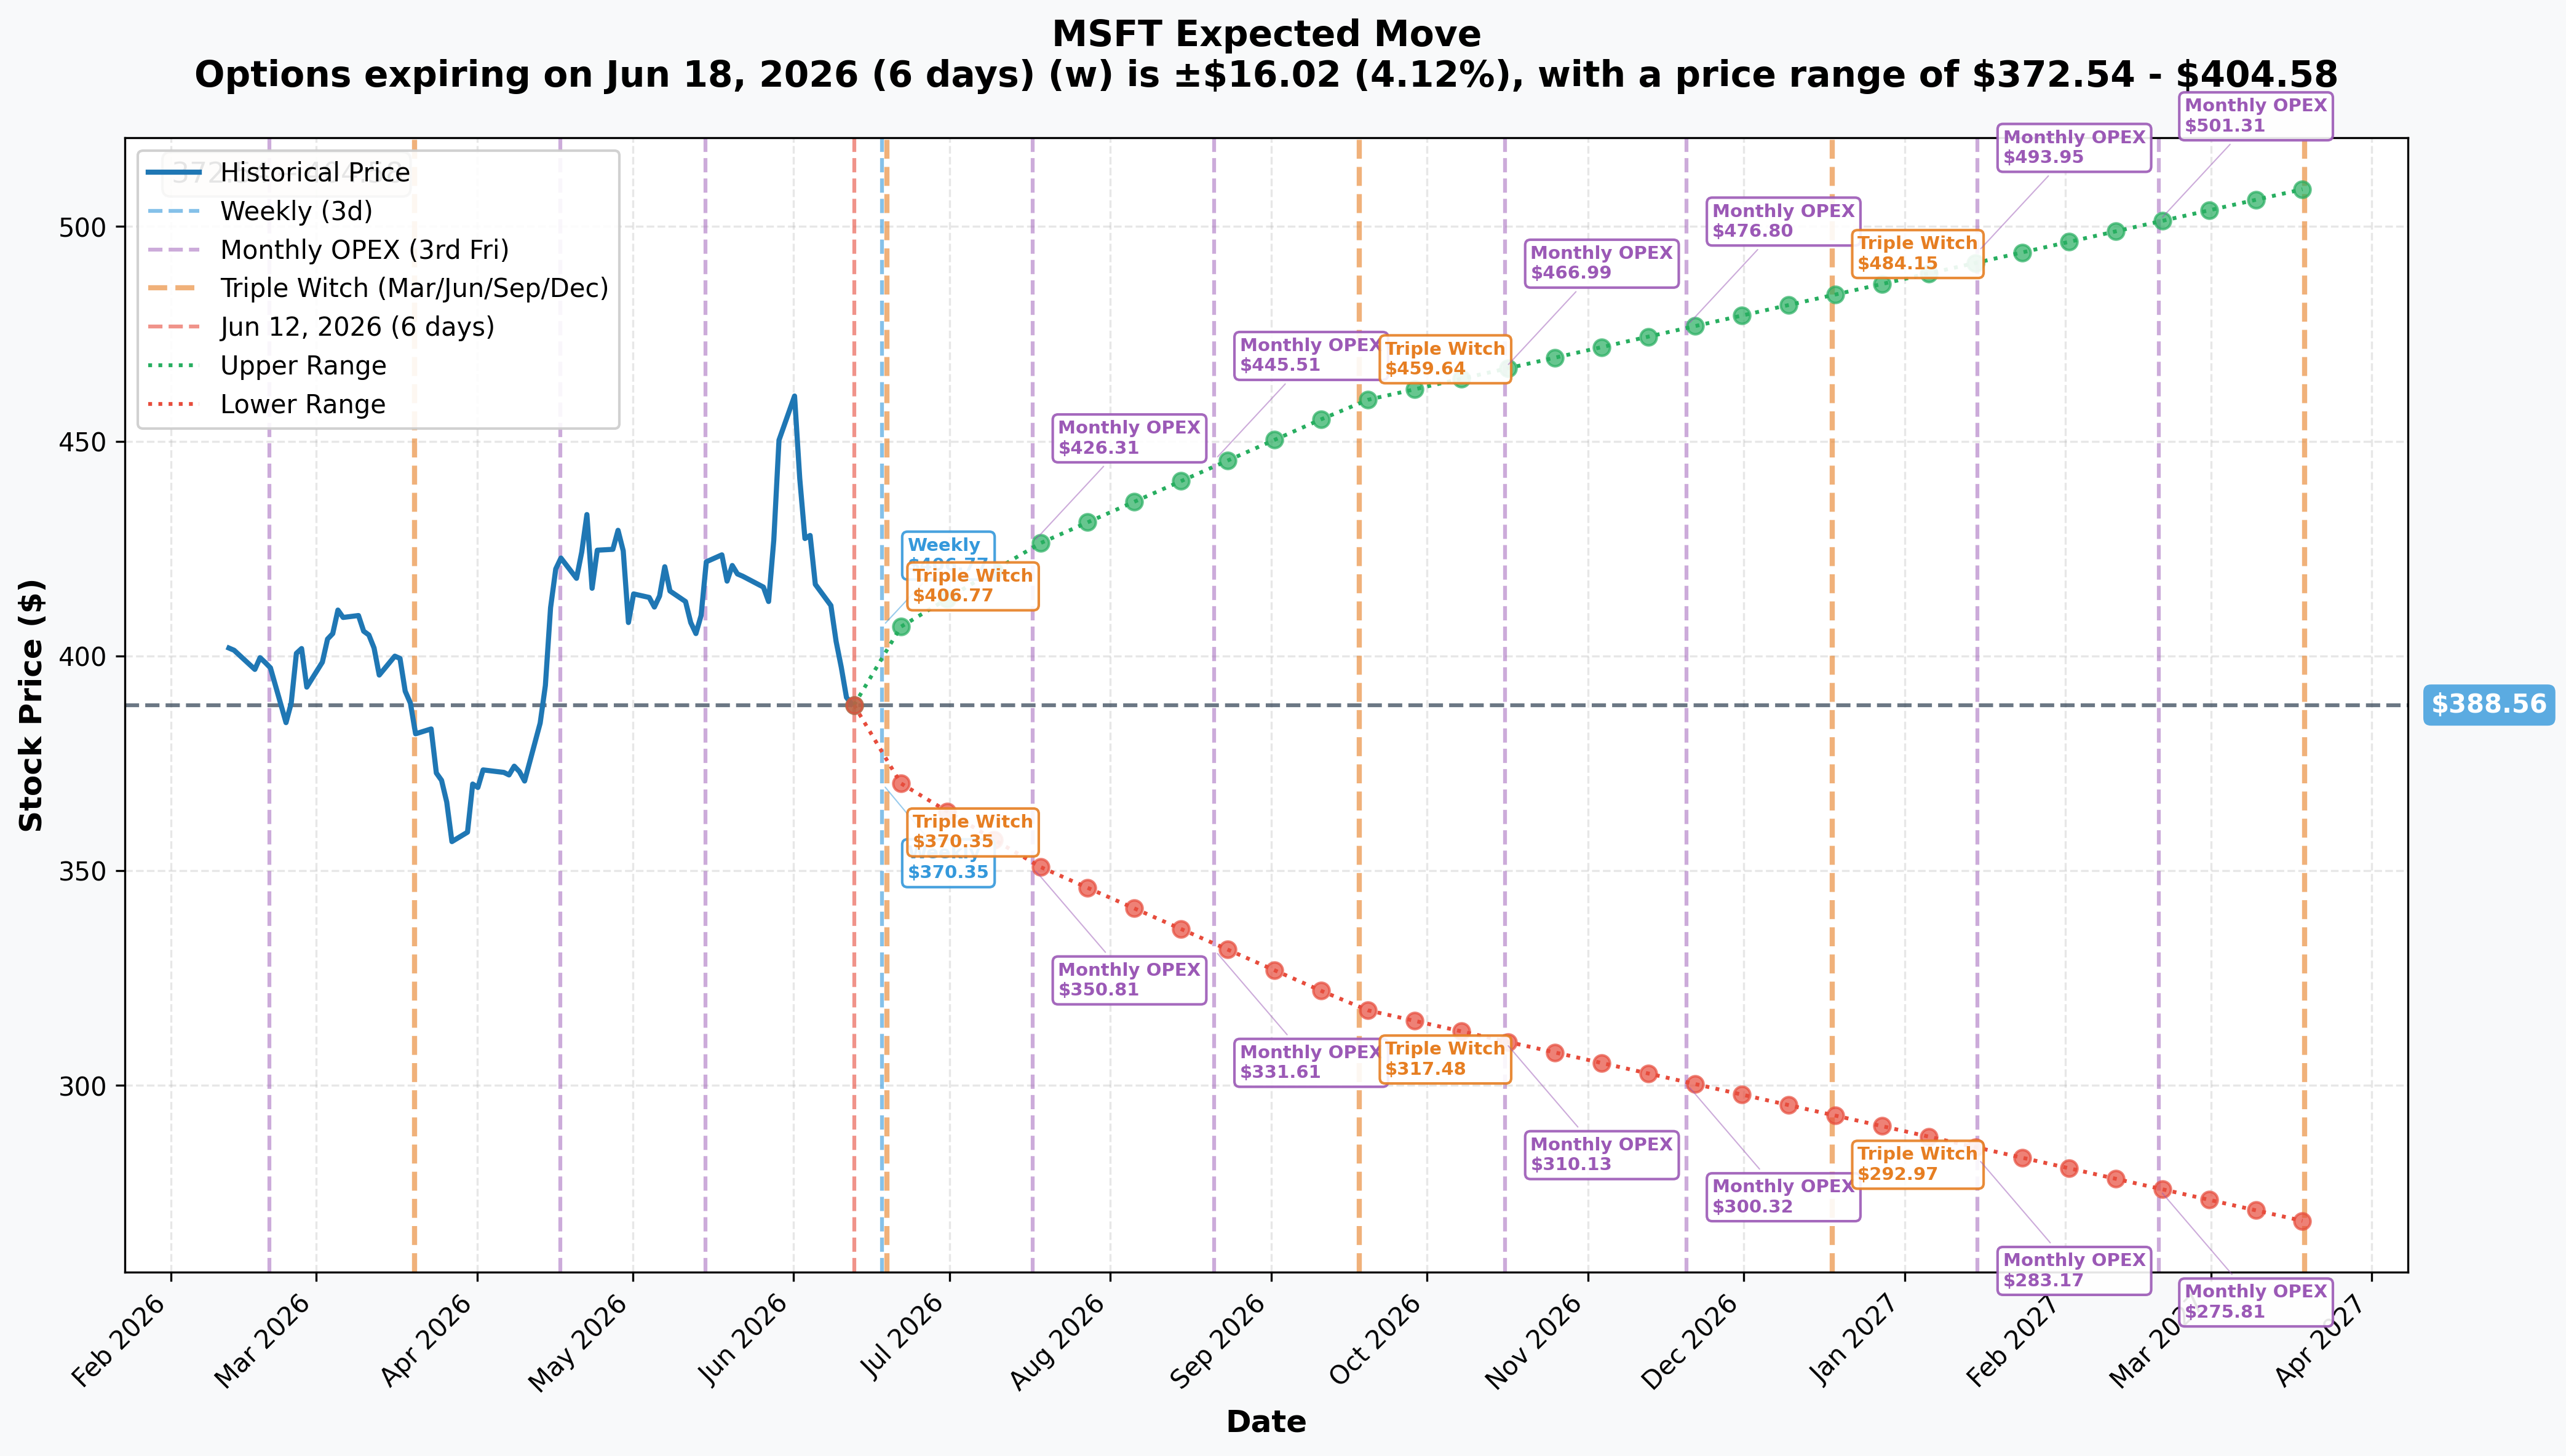
The options market is pricing in these expected move ranges from the current ≈$389 spot:
| Expiration | DTE | Implied Move | Expected Range |
|---|---|---|---|
| 📅 Monthly OPEX (July 17) | ≈35 days | ±9.58% (±$37.27) | $351.34 – $425.78 |
| 📅 Quarterly Triple-Witch (Sep 18) | ≈98 days | ±18.22% (±$70.88) | $317.75 – $459.37 |
Critical reads for both structures:
- 📉 The $420 put: The July 17 implied range tops out at $425.78, which means the options market considers $420 reachable to the upside — but the put is currently in-the-money at $388. For the put buyer to make money, they need MSFT to stay below the put's $376.30 breakeven or ideally continue lower. The July 28 earnings print lands inside the Aug-21 put window — a negative earnings reaction is the most plausible path to driving MSFT toward and below $376.
- 📈 The $450/$530 call spread: The September 18 implied range upper end is $459.37 — which barely clears the $450 call spread's long strike but falls well short of the $530 short strike's full value. The options market is pricing the Sep-18 upper range right around where the spread starts to become meaningful. If Q4 earnings on July 28 catalyze a re-rating, the market-implied moves suggest $450–$460 is achievable by September; $530 requires a substantial upside surprise above what the market currently prices.
Bottom line on the implied moves: Both structures are anchored to the July 28 earnings binary. The put profits if earnings disappoint and the stock retraces; the call spread profits if earnings re-rate the stock and momentum carries through the summer.
🎪 Catalysts
🔥 Already Happened — The Repricing
FY26 Q3 Earnings (April 29, 2026) — Beats across the board, stock fell anyway
Microsoft's Q3 results were genuinely impressive: revenue $82.9B (+18%), EPS $4.27 (+23%), Azure +40%, AI run-rate exceeding $37B at +123% YoY. The market sold it anyway. Why? Management disclosed full-year 2026 capex of ≈$190B — ≈23% above the ≈$155B Street estimate, with CFO Amy Hood attributing ≈$25B of the increase to surging memory and component costs. The stock has been de-rated on the capex-payback debate ever since.
Microsoft Build 2026 (June 2–3) — Products but no multiple re-rate
Build 2026 delivered 7 new MAI models, Azure Cobalt 200 VMs with +50% performance gains, and new M365 Copilot "Researcher" and "Analyst" reasoning agents. Technically impressive — but the market needed capex discipline, not product announcements, to re-rate the stock.
OpenAI deal restructured (April 27, 2026)
The revised OpenAI partnership lets OpenAI cap revenue-share payments and run workloads on AWS, Google, or Oracle — ending Azure exclusivity. Microsoft retains a ≈$228B equity stake and preferred-infrastructure status, but the structural moat narrowed.
📅 Upcoming — Both Structures Are Positioned for These
🔥 FY26 Q4 Earnings: July 28, 2026 (THE pivotal event for both legs)
This is the single most important date on the calendar for today's trades. The July 28 print lands after the August-21 put is still live and before the September-18 call spread expiry — making it the binary event that tips both structures in or out of the money direction-wise.
Per Investing.com, consensus expects ≈$89.37B revenue and ≈$4.33 EPS. What the market actually cares about:
- Azure growth vs. the guided 39–40% range (≈37% was the bar at Q3 time; acceleration above 40% is the re-rating trigger)
- Q4 capex actuals vs. the >$40B single-quarter guide; any upward revision is the bear catalyst
- Whether the AI run-rate is heading toward the ≈$40B mark
- FY2027 capex framing — the single biggest swing factor. If management signals capex efficiency and discipline for FY2027, the multiple de-rating reverses. If they guide capex higher again, the put buyer's thesis is confirmed.
📉 Xbox Restructuring — July 2026 (Near-Term Bearish Noise)
New gaming CEO Asha Sharma is expected to announce layoffs in early July — reportedly up to ≈1,000 roles with possible studio closures. A June 10 internal memo revealed the Xbox division spent >$20B over five years while revenue fell ≈$500M and division margin sank to ≈3%. A restructuring charge could create headline noise into the Q4 print, but the underlying margin story is a long-term positive if the reset sticks.
⚖️ FTC Antitrust Probe (Ongoing)
The FTC has intensified its probe into Microsoft's Azure cloud-licensing terms and Copilot/AI bundling across M365 and GitHub. This is an open-ended overhang that won't resolve before either option expires — it's a background risk that adds to uncertainty without a clear catalyst date. Further detail on the FTC's focus.
📈 September Dividend Hike (≈mid-September announcement)
Microsoft has raised its dividend 16 consecutive years — a high-single/low-double-digit raise is historically announced in mid-September, alongside the existing $60B buyback authorization. This lands just after the Sep-18 call spread expiry but supports a constructive autumn backdrop.
🎲 Price Scenarios Through Both Expiries
📉 Bear Case — Put Profits, Call Spread Expires Worthless
MSFT at or below ≈$376 by Aug-21; drifts below $450 into Sep-18
- 💡 Q4 earnings on July 28 disappoints — Azure below 39%, capex above $40B Q4, and another FY2027 capex upward revision
- 📉 Stifel's $392 bear target looks prescient; the stock retraces toward the gamma support zone at $380–$385
- 🤖 Xbox restructuring charge hits the July print; negative headline risk
- 💔 $420 put: intrinsic value grows as MSFT falls below $420; maximum profit below ≈$376.30
- ❌ $450/$530 call spread expires worthless; full $12.8M net debit is lost
Gamma floor to watch: the $380 Very Strong support wall is the key level in a bear scenario. Below $380 the gamma cushion thins and the put buyer's position accelerates in value.
⚖️ Base Case — Both Structures Pressured, Gridlock Continues
MSFT grinds between $380–$420 through both expiries
- 📊 Q4 earnings is a soft beat — Azure holds 39–40% but no re-rating catalyst; capex tracks in line with the >$40B guide
- 🔄 Stock stays pinned by the gamma walls at $387.50–$390 (support) and $390–$420 (resistance)
- 💰 $420 put: remains in-the-money on the strike but the ≈$11.92 time value decays; put buyer needs MSFT to continue falling to offset theta bleed
- ⚠️ $450/$530 call spread: MSFT fails to clear the $450 breakeven; full $12.8M debit lost at expiry if MSFT stays below $457.36
🚀 Bull Case — Call Spread Gains, Put Becomes Worthless
MSFT rallies above $450 by Sep-18 (implied upper range ≈$459 from Sep-18 market pricing)
- 💥 Clean Q4 earnings beat — Azure +42%, gross margins recover, FY2027 capex discipline signaled
- 🌐 Morgan Stanley's $650 target and Wedbush's $575 attract momentum buying; stock recovers toward the quarterly implied-move upper range (≈$459)
- 🤖 Copilot monetization acceleration: 20M paid seats growing shows the ≈3.3% penetration rate starting to inflect
- 📈 $450 call goes in-the-money; $530 call caps the upside. At $459 (options market's Sep-18 upper range), the spread captures ≈$1.41 per share — meaningful but well below the $80 max spread width
- 💔 $420 put: expires worthless at any price above $420; full $22M premium lost if MSFT is above $420 at August 21
Path to full spread value ($530+): Requires a ≈37% rally from ≈$388 — roughly two earnings beats with clean capex stories, plus multiple expansion from the current depressed levels. The September quarterly implied move tops at $459.37 — to hit $530 would require the stock to trade ≈15% above the options market's current implied upper bound.
💡 Trading Ideas (4 Reader Types)
🚀 YOLO Trader
You want exposure to the July 28 earnings binary? Today's flows suggest the smart money is positioning, not guessing — the call spread is a bullish bet with a defined loss floor ($12.8M max loss for the desk), and the put is a protection/bearish bet with a known cost ($22M). You can replicate a smaller version of either logic.
For a directional bull bet into earnings: a smaller bull call spread (e.g., buy MSFT Sep-18 $390C / sell $430C, cost ≈$8–10 per spread) captures upside if the stock bounces from current levels without risking everything on an outright call. Max loss = your debit. Max gain = the $40 spread width minus your cost.
Risk: HIGH. The July 28 earnings print is a binary event. If MSFT gaps down on another capex surprise, these expire worthless. Size to what you can afford to lose entirely.
⚖️ Swing Trader
The two competing flows tell you today's key levels: $420 is where the bears are defending (put strike, top gamma resistance), $450 is where the bulls are targeting (call spread's long strike). The July 28 earnings print is the swing catalyst.
A clean playbook: wait for the July 28 print. If MSFT gaps up above $400–$410 with strong Azure numbers and no capex upside, consider a call spread in the Aug-21 expiry to ride the momentum. If it gaps down on another capex miss, the $380–$385 gamma support is the first bounce level to watch.
Implied move through July 17 OPEX is ±9.58% (range: $351.34–$425.78) — that range tells you the magnitude to plan around.
🛡️ Premium Collector
Here's your angle: with both a bull call spread buyer and an ITM put buyer in the market, implied volatility has to reflect the genuine two-sided uncertainty around July 28 earnings. Elevated IV = elevated option premiums across the board.
Wait for the July 28 print to resolve the binary. After earnings, IV typically collapses ("vol crush") — that's your window. If the stock settles into a new range post-earnings, sell a covered call or a bull put spread to collect premium into the Sep-18 expiry while vol is still elevated from the event aftermath. The gamma walls at $387.50/$385 are your strike-anchoring guides.
📚 Entry-Level Investor (Just Starting With Options)
Today's flow is a perfect teaching moment about how the same stock can attract two completely different professional theses on the same day. Neither desk is necessarily "right" — they're expressing different risk/reward bets on a binary event (July 28 earnings).
Here's the simplest way to think about it:
- 🐂 Bull call spread = paying ≈$12.8M for the right to profit if MSFT rallies hard. The most you can lose is what you paid in. It's like buying a lottery ticket with a guaranteed floor on your loss — but you need a big move to win.
- 🐻 ITM put block cross = paying $22M for the right to profit if MSFT stays weak or falls further. The put is already in-the-money (MSFT is already below the $420 strike), so part of that $22M is intrinsic value — real, provable worth right now.
Lesson: Big money doesn't always agree. When you see two opposite structures on the same stock the same day, it usually means a major binary event is coming (July 28 earnings) and professionals are hedging, speculating, or positioning in different ways based on their individual views. That's normal — and it's actually healthy market behavior. Don't let conflicting flow paralyze you; focus on the catalyst and how you want to express your own view with defined risk.
⚠️ Risk Factors
What could hurt either structure — and what the tape cannot tell us:
-
💥 July 28 earnings is the single decisive event for both legs. The FY26 Q4 print with its FY2027 capex guide will move the stock more than any other catalyst in the Aug-21 or Sep-18 window. Consensus expects ≈$89.37B revenue and ≈$4.33 EPS — a miss on Azure or a capex upward revision could send MSFT below the put's $376.30 breakeven; a blowout beat with capex discipline could drive toward the call spread's $450–$530 zone.
-
📊 ≈$190B capex overhang remains the primary bear driver. Until Microsoft demonstrates the AI revenue ramp that justifies the spend — with AI currently at $37B run-rate vs. a ≈$190B capex — the multiple stays compressed. This is the core thesis behind the put block.
-
⚖️ FTC antitrust probe is open-ended. Azure licensing terms and Copilot/AI bundling are under investigation with no clear resolution date. A negative development before either expiry adds headline risk.
-
📉 Xbox restructuring in July. Layoffs, potential studio closures, and a restructuring charge could create negative headlines near the July 28 earnings print. At ≈3% margins and ≈$500M revenue decline over five years at enormous cost, the Xbox division has been a drag. Near-term noise; longer-term margin positive if the reset holds.
-
🤖 Copilot monetization risk. Paid-seat penetration remains at ≈3.3% of the commercial Microsoft 365 base. The bull case for the call spread depends on this number accelerating — if it stalls, the $450 breakeven becomes a harder reach.
-
🔍 What the tape cannot tell us. OPRA shows us the structure, size, price, and mechanism. It cannot tell us: the identity of the counterparties, whether the ITM put is a hedge against a long MSFT stock position (in which case the $22M is insurance, not a bearish bet), whether the call spread desk has offsetting short positions elsewhere in the portfolio, or what brokerage facilitated either trade. The block-cross structure on the put especially signals a pre-arranged, known-counterparty trade — the "counterparty took the other side" framing is essential. Weigh the open/close verification and the July 28 print as the next key data points before drawing strong directional conclusions.
🎯 The Bottom Line
Real talk: Today's MSFT options tape handed us a genuinely split signal — and that split is intellectually honest. A ≈$13M bull call spread bets on a autumn recovery above $450 while a $22M ITM put block hedges (or bets on) continued downside below ≈$376. Both are plausible given where Microsoft sits: a cloud-and-AI powerhouse with spectacular fundamentals (Azure +40%, $37B AI run-rate, $228B OpenAI stake) that still can't shake the ≈$190B capex shadow and has spent all year down ≈14%.
The key scenarios:
- ✅ Own it (bullish): July 28 earnings delivers Azure acceleration and credible FY2027 capex discipline. The call spread pays off as MSFT re-rates toward $450+. Gamma resistance at $390–$420 yields. The market — which already has 85% Buy consensus with an average target of ≈$576 — was just waiting for a reason to buy.
- 👀 Watching (neutral): MSFT grinds in the $380–$420 range through Q4 earnings, unable to clear gamma resistance or break support. Both structures struggle — the call spread loses its debit; the put decays without a fresh leg down.
- 🐻 Bearish: July 28 brings another capex upside surprise or Azure misses the 39–40% guidance. The stock tests $380 gamma support then $376 (the put breakeven). FTC and Xbox noise compound the pressure. The put block holder profits.
Mark your calendar:
- 📅 June 15, 2026 (pre-market ≈06:30 ET) — next-day OI for the $420P, $450C, $530C. Verify all four legs opened as expected.
- 📅 Early-to-mid July 2026 — Xbox layoff announcement from CEO Asha Sharma. Restructuring charge headline risk.
- 📅 July 28, 2026 — FY26 Q4 earnings. The binary event for both structures. Azure growth rate, capex actuals, and FY2027 guidance are the market-moving variables.
- 📅 August 21, 2026 — $420 put expiry. Full value if MSFT is at or below ≈$376.30; expires worthless above $420.
- 📅 September 18, 2026 — $450/$530 call spread expiry. Max value ($80/share) if MSFT is at or above $530; expires worthless below ≈$457.36.
Disclaimer: Options trading involves substantial risk of loss and is not suitable for all investors. This analysis is for educational and informational purposes only and does not constitute financial advice or a recommendation to buy or sell any security. The structures described carry defined but material risk of total premium loss (call spread: up to ≈$12.8M; put block: up to ≈$22M). The open/close status of these trades is provisional pending next-day OPRA OI confirmation — open/close framing may change materially once the June 15 snapshot is available. Past performance is not indicative of future results. Always consult a licensed financial advisor before making investment decisions.
Last updated: June 12, 2026
Last updated: 2026-06-15 — next-day OPRA OI resolved all legs (all OPEN confirmed; corrected the $450C prior-OI baseline from a bad feed value of 2 to the true 11,615).
About Microsoft Corporation: Microsoft is a ≈$2.88 trillion mega-cap technology company in the Software-Infrastructure sector, operating Azure (Intelligent Cloud), Microsoft 365/Copilot (Productivity & Business Processes), and Windows/Xbox (More Personal Computing). Azure and its AI services are the central growth engine and dominant share-price driver in 2026.