🟠 MSTR $14.9M Multi-Leg Call Block — Whale Rolls Into Higher Strikes Before May 5 Earnings
📅 April 16, 2026 | 🔥 Unusual Options Activity
🎯 The Quick Take
At 09:32:27 this morning, a single trader executed four simultaneous call legs totaling $14.9M in premium on MSTR — all at ~8,000 contracts, all on the MID exchange, all at the open. The structure is a coordinated roll: selling a deep-in-the-money $134 call (collecting $7.5M) and rotating that capital into three higher-strike calls across two expirations, locking in a near-zero net cost restructure. With spot at $143.01 and the May 5 Q1 earnings catalyst sitting 19 days out, this whale isn't exiting — they're repositioning up the strike ladder for more upside leverage.
📊 Company Overview
Strategy Inc (NASDAQ: MSTR) — formerly MicroStrategy, rebranded August 2025 — is the world's largest corporate Bitcoin treasury vehicle.
- 💰 Market Cap: ~$26.6B
- 🟠 Bitcoin Holdings: 780,897 BTC (~$57.6B at ~$73,800/BTC), acquired at an average cost basis of $75,577/coin
- 📉 Current Price: $143.01 (spot at trade time); 52-week range $104.17 – $457.20
- 📊 mNAV Premium: ~1.20x (compressed from historical 1.57x average)
- 🏦 Capital Stack: Common ATM + STRK/STRF/STRC/STRD perpetual preferreds + ~$8.2B in convertible notes at 0.421% weighted-average rate
- 🎯 Strategy: Accumulate Bitcoin through capital markets; target 1 million BTC by end of 2026
MSTR's software business generated $477M in FY2025 revenue, but the stock trades almost entirely as a leveraged Bitcoin proxy. It holds ~3.6% of all Bitcoin ever mined — more than any publicly traded company by a massive margin.
💰 The Option Flow Breakdown
The Tape (April 16, 2026 @ 09:32:27 — all MID exchange, simultaneous block) on MSTR:
| Time | Side | Type | Expiration | Strike | Volume | OI | Size | Spot | Option Price | Premium | Classifier |
|---|---|---|---|---|---|---|---|---|---|---|---|
| 09:32:27 | BUY | CALL | 2026-04-17 | $140 | 8,200 | 1,400 | 7,998 | $143.01 | $4.48 | $3.6M | Closing Call (Z=1.61) |
| 09:32:27 | BUY | CALL | 2026-04-24 | $150 | 8,100 | 2,000 | 7,998 | $143.01 | $3.18 | $2.5M | Closing Call (Z=6.21 ⚡) |
| 09:32:27 | BUY | CALL | 2026-04-24 | $157.5 | 8,000 | 400 | 7,998 | $143.01 | $1.63 | $1.3M | Long Call (BTO) |
| 09:32:27 | SELL | CALL | 2026-04-17 | $134 | 8,000 | 18,000 | 7,998 | $143.01 | $9.39 | $7.5M | Closing Call (STC, Z=1.78) |
Total gross premium involved: ~$14.9M | Net premium (bought minus sold): ~$0 cost-neutral restructure
🤓 What This Actually Means
This is a simultaneous four-leg roll executed as a single block at the open — one of the cleanest restructuring trades you'll see. Here's how to read it:
The outgoing leg:
The trader sold to close 8,000 contracts of the Apr 17 $134 call at $9.39, collecting $7.5M. At spot $143.01, this call is $9 in-the-money with only one day left. Selling it now books the ITM intrinsic value and frees up the position. The OI at 18,000 confirms this is an existing position being unwound, not a new short.
The incoming legs:
That $7.5M in proceeds gets recycled into three separate call purchases totaling ~$7.4M:
- 🟠 $140 call (Apr 17, $3.6M) — Still in-the-money with one day left. This replaces the $134 call with a slightly higher strike for tomorrow's expiration. Roughly maintaining short-term exposure while reducing dollar risk if price slips.
- 🟠 $150 call (Apr 24, $2.5M) — Out-of-the-money, 8 days out. A directional bet that MSTR pushes through $150 by next Friday. The Z-score of 6.21 (classified EXTREMELY UNUSUAL) flags this leg as the most anomalous vs. recent history — volume at 4x open interest.
- 🟠 $157.5 call (Apr 24, $1.3M) — Deep out-of-the-money, 8 days out. High-conviction lotto on a $157.5 print by April 24 — approximately a 10% move from current spot.
The overall structure: The trader closes a near-expiry ITM position and rolls proceeds into a spread of higher strikes across two expirations. The net cost is essentially zero — the $134 call sale fully finances the three call purchases. This is not a new bearish or neutral position. It is an upside restructure: taking chips off the deeply ITM near-expiry leg and redeploying into higher-strike, longer-dated calls with more convexity.
The nearly identical contract size (~7,998) across all four legs, same exchange, same timestamp, confirms these were submitted and filled as a coordinated block — not four independent trades.
💡 Translation: This whale made money on the $134 call as MSTR moved from the 130s toward current levels. Rather than just cashing out, they're using those profits to bet MSTR goes even higher — to $150 and $157.5 — before April 24, conveniently one week before the May 5 earnings.
📈 Technical Setup
YTD Performance Chart
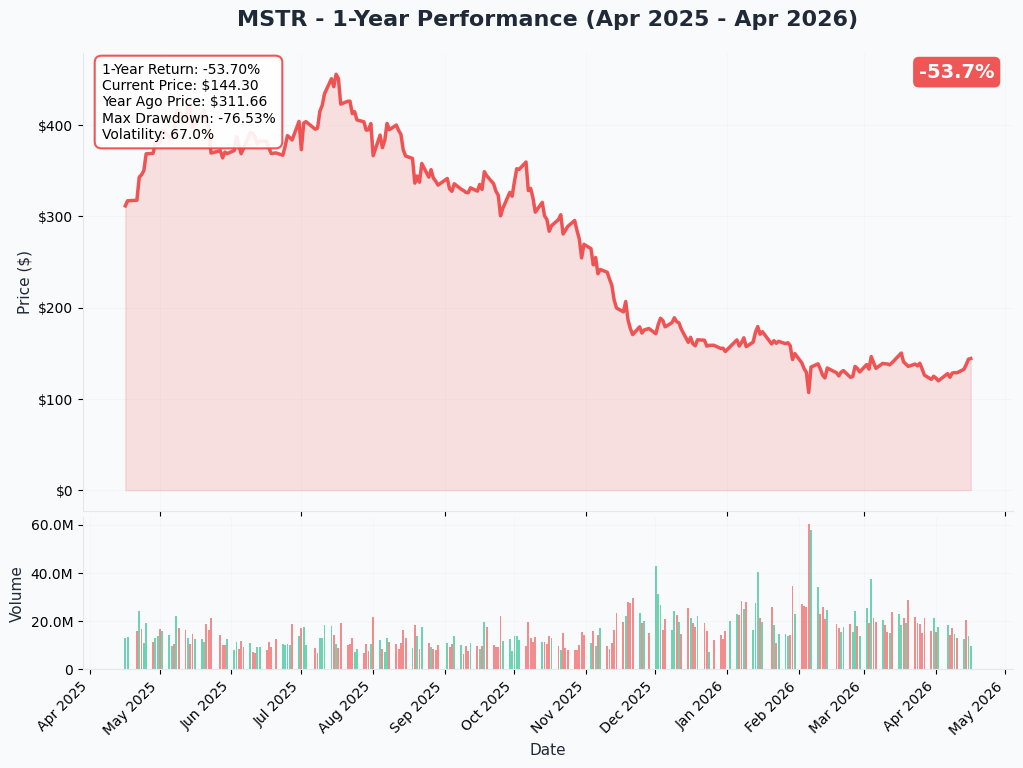
MSTR is trading around $143, deep in the lower half of its 52-week range ($104.17 – $457.20). The stock was decimated in the February 2026 Bitcoin crash — Bitcoin briefly touched $60,000 in a -6.05σ single-day event, dragging MSTR down from its late-2025 high of $457.20 to lows near $104. The YTD chart shows a base-building pattern through March and early April, with recent stabilization as BTC has recovered toward $73–74K.
Key observations:
- 📉 YTD move: Sharply negative — roughly halved from late-2025 highs
- 🔄 Recent stabilization: Price has been building a base in the $120–145 range since March
- 📊 Trend: No clear reversal confirmed yet; price is consolidating below key moving averages
- ⚠️ Cost basis overhang: Strategy's average BTC cost basis of $75,577 sits above current ~$73,800 BTC spot — the company is technically underwater on its most recent purchases
Gamma-Based Support & Resistance
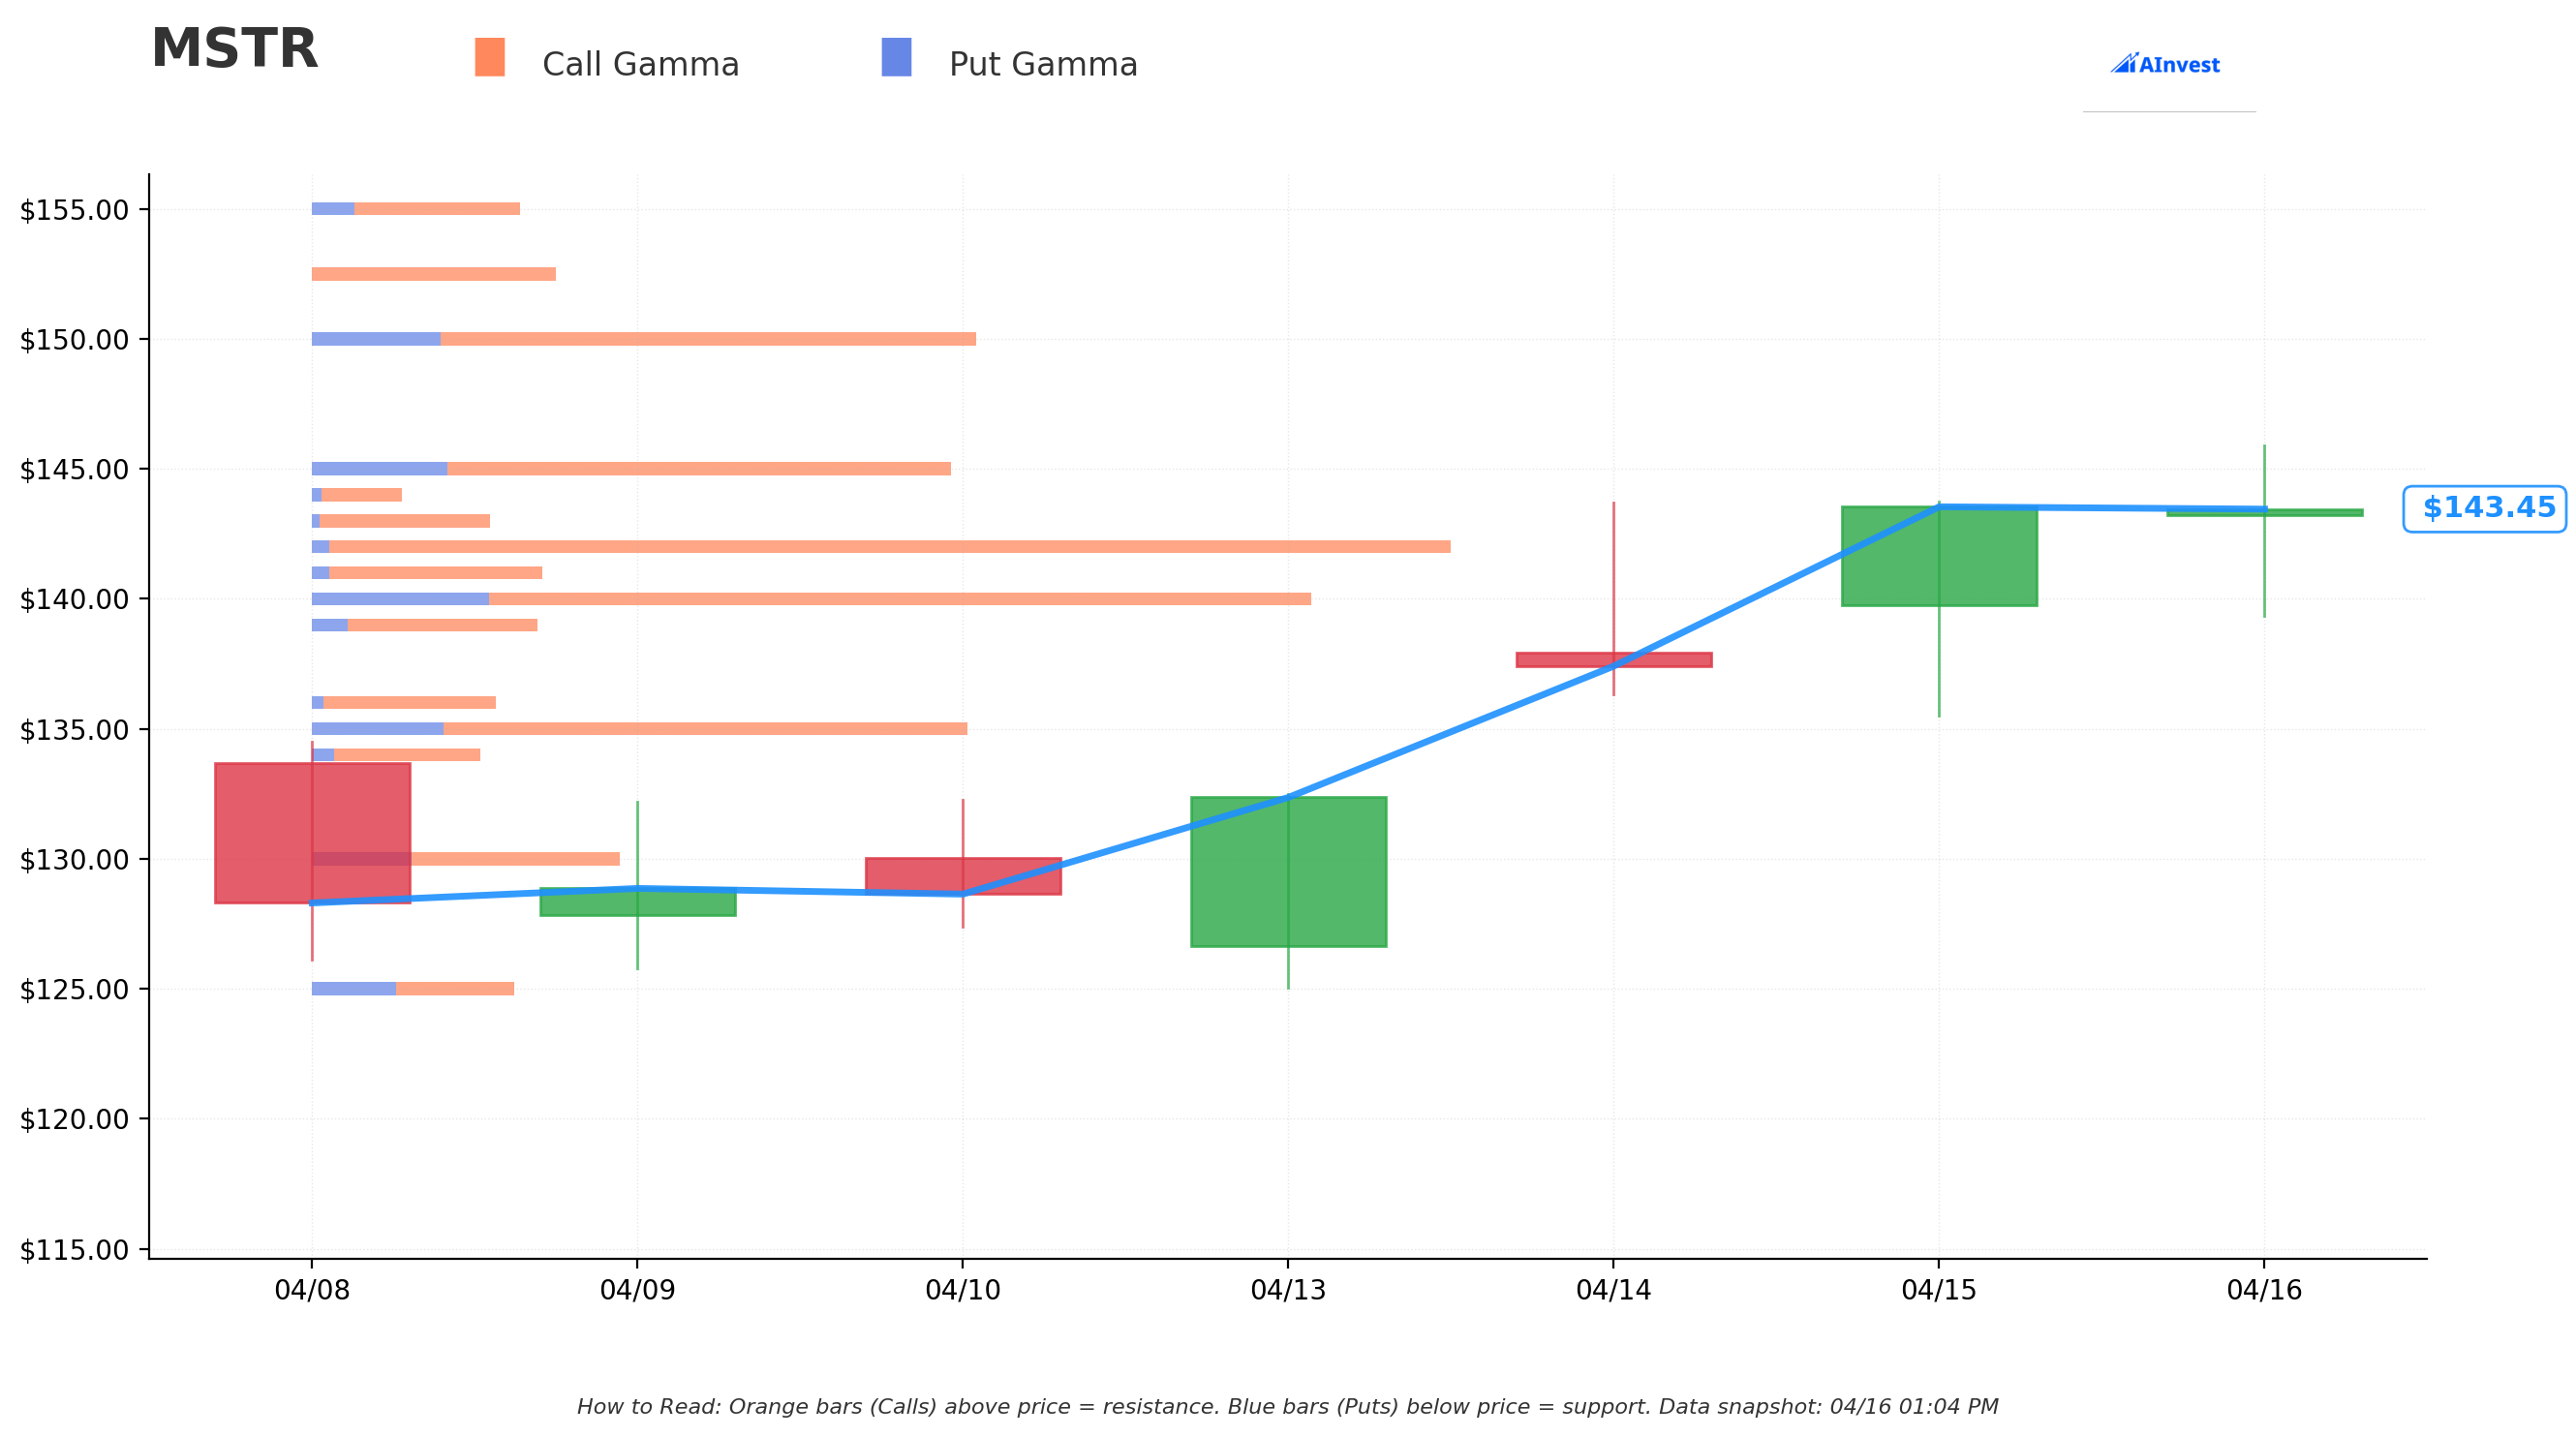
MSTR Current Price: $143.21 (GEX snapshot)
The gamma exposure map from today's options market shows the following key levels (net GEX in millions, call-dominant book):
🔵 Support Levels (call gamma below price — dealers buy dips to hedge):
| Strike | Net GEX | Distance | Context |
|---|---|---|---|
| $142 | 39.1M | -0.84% | Strongest immediate support — largest call GEX below price |
| $141 | 7.0M | -1.5% | Secondary support |
| $140 | 23.5M | -2.2% | Significant floor — also the strike of Leg 1 in today's trade |
| $139 | 5.6M | -2.9% | Tertiary support |
| $135 | 11.3M | -5.7% | Broader support zone |
| $130 | 3.7M | -9.2% | Deep floor |
🟠 Resistance Levels (call gamma above price — dealers sell into rallies):
| Strike | Net GEX | Distance | Context |
|---|---|---|---|
| $145 | 12.9M | +1.3% | First overhead ceiling |
| $150 | 13.8M | +4.7% | Key resistance — also the strike of Leg 2 in today's trade |
| $152.5 | 8.5M | +6.5% | Secondary resistance |
| $160 | 3.9M | +11.7% | Extended upside target |
Net GEX bias: Bullish (235M call GEX vs 62M put GEX). The overall book is heavily skewed toward calls, meaning market makers are net long gamma below current price — they'll buy dips at $142 and $140 aggressively. The $145 and $150 resistance levels are exactly where today's whale is betting MSTR needs to break through.
Notice how the two out-of-the-money legs of today's trade — the $150 and $157.5 calls — sit right above the two main resistance levels in the GEX map. This trader knows where the gamma walls are and is positioning for a breakout above them.
Implied Move Analysis
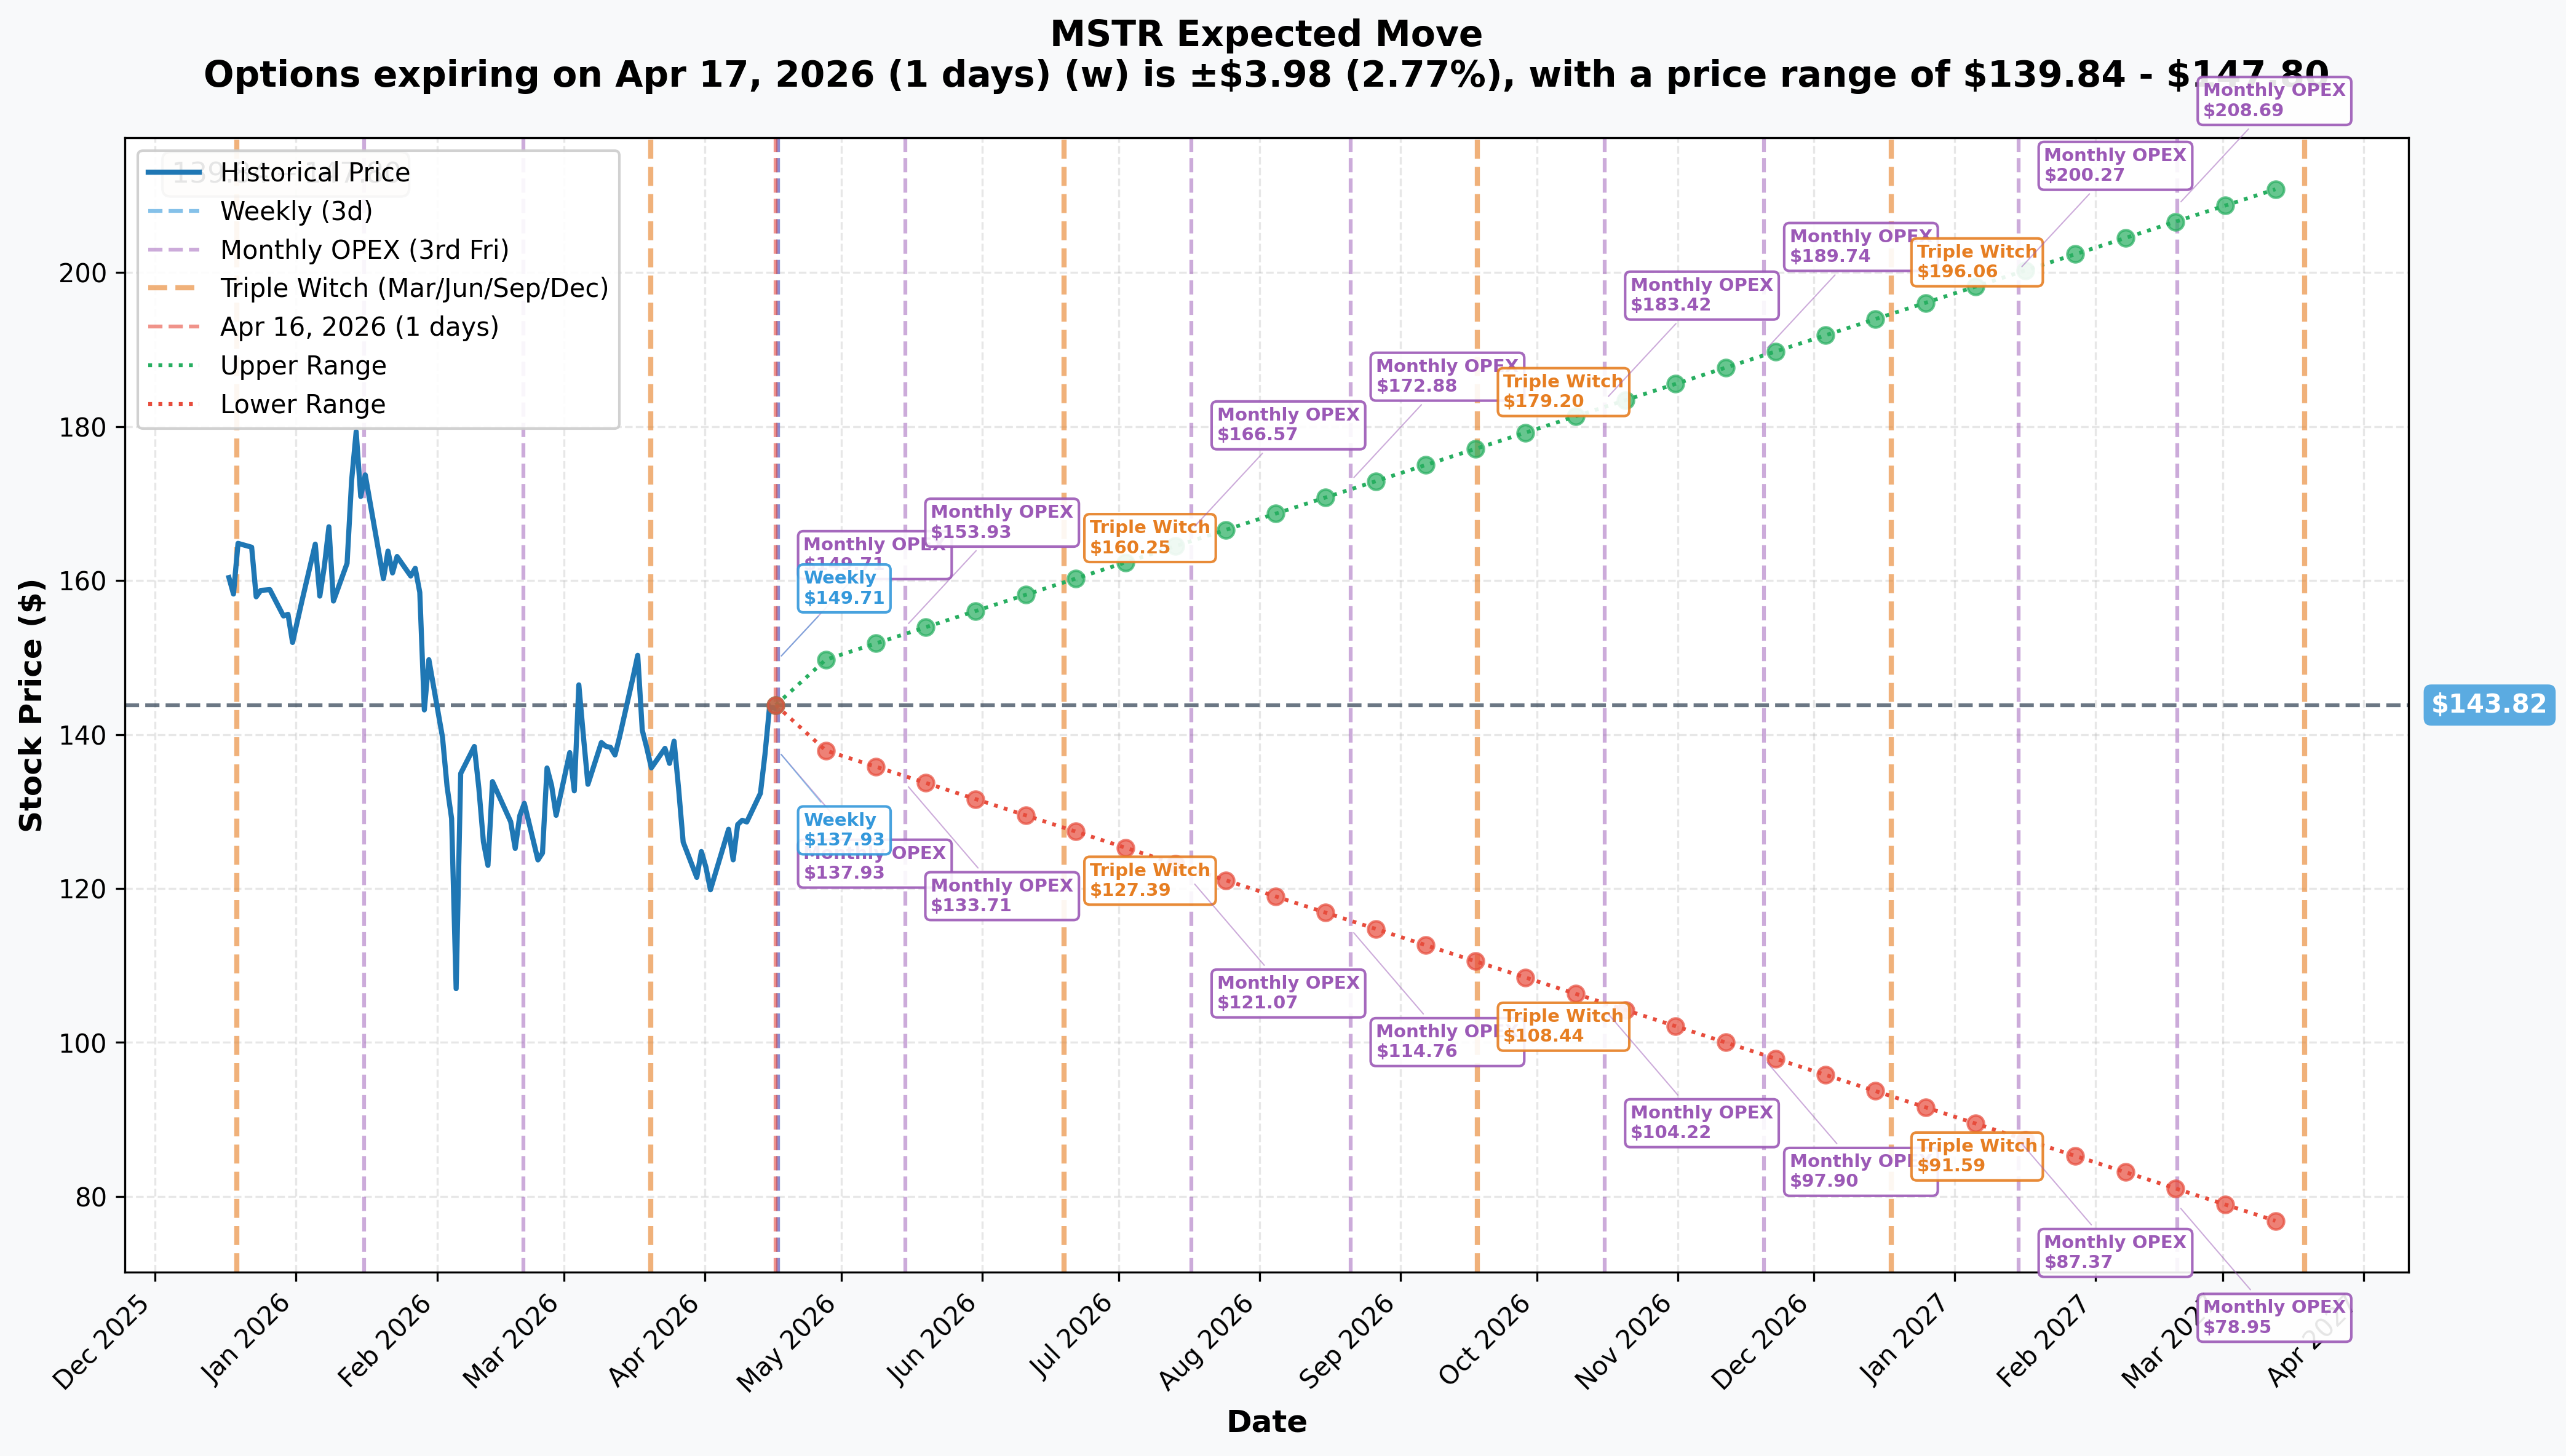
Options market-implied ranges (from today's pricing):
| Timeframe | Expiry | Days | Implied Move | Range |
|---|---|---|---|---|
| Weekly / Apr OPEX | 2026-04-17 | 1 day | ±2.77% / $3.98 | $139.84 – $147.80 |
| May OPEX | 2026-05-15 | 29 days | ±$10.22 | $133.71 – $153.93 |
| June Triple Witch | 2026-06-19 | 64 days | ±$16.41 | $127.39 – $160.25 |
| July OPEX | 2026-07-17 | 92 days | ±$22.75 | $121.07 – $166.57 |
| LEAPS (Mar 2027) | 2027-03-19 | 337 days | ±47.5% / $68.32 | $75.50 – $212.14 |
Key reads:
- 🎯 $150 strike (Leg 2 of today's trade) sits just above the May OPEX upper range of $153.93 — the market prices in roughly a 16% probability of reaching $150+ by the May 15 OPEX. By Apr 24, the probability is lower still.
- 🎯 $157.5 (Leg 3) sits near the June Triple Witch upper range of $160.25 — the Apr 24 timeframe prices this as a low-probability lotto play.
- 🎲 The LEAPS range of $75.50 – $212.14 underlines the enormous annual volatility embedded in this stock. MSTR is a 47.5% implied-move animal over 12 months — directional bets here are inherently wide.
The one-day implied move of just ±2.77% for tomorrow's OPEX explains why the trader replaced the $134 call with the $140 call (rather than holding through) — they're managing the overnight risk on a 1-DTE position while extending the duration of the bigger directional bets to April 24.
🎪 Catalyst Context
Recent Events (Past 3 Months)
Q4 2025 Earnings / February 2026 Bitcoin Crash
Strategy reported a $12.4B GAAP net loss for Q4 2025, driven by a $17.4B unrealized digital asset loss under FASB's new fair-value accounting standard. This coincided with Bitcoin's February 2026 collapse toward $60,000 — a historically severe single-day move of -6.05σ that triggered $3.8B in U.S. spot BTC ETF outflows over five consecutive weeks. MSTR fell from its $457 highs to the low $100s.
MSCI Decision — January 6, 2026
MSCI announced it would NOT exclude digital asset treasury companies from its global investable market indexes — earlier than the January 15 deadline. Forced selling estimates of $10–15B across 39 DATCOs (of which MSTR represented ~74.5%) were averted, triggering a 6% MSTR rally. Bloomberg noted MSCI signaled a broader, longer consultation — the issue is deferred, not resolved.
$42B Capital Plan — March 2026
In March 2026, Strategy announced a new $42B capital-raising program ($21B common ATM + $21B STRC preferred ATM), replenishing the depleted equity side of the original "21/21" plan. Bloomberg confirmed a cumulative ~$84B "42/42" fundraising target through 2027.
April 6–12, 2026: Latest BTC Purchase
Strategy sold ~10M shares of STRC preferred for ~$1B and added 13,927 BTC at $71,902/coin average, bringing total holdings to 780,897 BTC. This was the most recent Bitcoin purchase before today's options trade.
Upcoming Catalysts (Next 6 Weeks — the Critical Window)
🟠 Bitcoin 2026 Conference — Las Vegas, April 27–29, 2026
Michael Saylor is a confirmed speaker at the Bitcoin 2026 conference in Las Vegas, April 27–29. Strategy is also hosting a "Bitcoin for Corporations" summit alongside the main event. Historically, Saylor has used these venues to announce acquisition milestones or capital plan updates. The April 24 options expiration (Legs 2 and 3 of today's trade) falls just three days before this conference — if this trader expects a Saylor catalyst at Bitcoin 2026, the April 24 calls capture the pre-conference positioning window precisely.
📊 Q1 2026 Earnings — May 5, 2026 (19 days out)
Consensus revenue: ~$126.76M (+12% YoY); Consensus EPS: –$35.56. The EPS loss is entirely mechanistic — it reflects BTC fair-value mark-to-market under FASB ASU 2023-08 at whatever Bitcoin price sits on March 31. With BTC around $73–74K at quarter-end, vs. the prior quarter's higher levels, the GAAP loss headline will be large and largely irrelevant to the stock reaction. What will matter: BTC Yield trend, mNAV trajectory, STRC issuance pace, and any update on the 1M BTC milestone timeline.
📅 STRC Monthly Dividend — April 30, 2026
$0.958333/share at 11.50% annualized; record date was April 15, 2026. Payable April 30. Treated as non-taxable return of capital for U.S. federal tax purposes. A reminder that the preferred stack dividend obligations are real and growing.
🟠 BTC Post-Halving Cycle Window
The post-2024-halving peak window historically falls 12–18 months after the halving, placing the apex between April–October 2026. Standard Chartered and several institutional analysts have $150K BTC as a median bull case. At $150K BTC, Strategy's 780,897 BTC holdings would be worth ~$117B — against a $26.6B market cap today. That math is the core bull thesis for why this whale is buying calls.
📊 Bull vs Bear Case
🚀 Bull Case — BTC Breaks Out, mNAV Expands
Targets: $150 short-term (Apr 24 OPEX) / $175–$212 medium-term (June–March LEAPS range)
The key variables for the bull case:
- ✅ Bitcoin reclaims $80K+ on post-halving cycle momentum, moving toward $100K+ bull targets
- ✅ mNAV premium re-expands from the current depressed 1.20x back toward the historical 1.57x average — at 1.5x mNAV and $80K BTC, MSTR would be worth ~$180+
- ✅ Saylor announces progress toward the 1M BTC milestone at the Bitcoin 2026 conference (April 27–29)
- ✅ May 5 earnings avoids a negative surprise; BTC Yield metric holds above 20%; subscription software business shows continued 60%+ YoY growth
- ✅ S&P 500 re-consideration enters discussion if Q1 shows GAAP profitability rebound on BTC recovery
Gamma road map in this scenario: $145 resistance clears first, then $150 (where dealer short gamma becomes a tailwind past that strike). GEX data shows the $150–$152.5 zone is the next major call gamma wall — breaking through it could accelerate momentum toward $157.5 and $160. The three OTM calls in today's trade are structured precisely along this path.
🐻 Bear Case — BTC Rolls Over, mNAV Compresses to 1.0x
Support zones: $140 → $135 → $130
The risk factors to watch:
- ❗ Bitcoin retests the $60,000 February lows or breaks below, driven by persistent ETF outflows or macro deterioration — Strategy's cost basis of $75,577 is already underwater on the latest purchases
- ❗ mNAV compresses toward 1.0x parity — at that point, ATM equity issuance becomes dilutive rather than accretive on a per-share BTC basis, breaking the core flywheel mechanism that justifies owning MSTR over a spot BTC ETF
- ❗ MSCI's ongoing broader consultation on non-operating companies reaches a negative conclusion — a repeat of the December 2025 overhang with forced selling of $10B+ in MSTR by index funds
- ❗ Analyst PT cuts continue: Canaccord at $185, BTIG at $250, Mizuho at $320 — the low end of the analyst range ($131.30) sits just below current price
- ❗ Growing preferred dividend obligations (STRK 8%, STRF 10%, STRC 11.5%, STRD 10%) strain the $2.25B USD Reserve if BTC income doesn't recover
- ❗ Spot BTC ETFs (IBIT, FBTC) continue to attract capital as a cleaner, cheaper BTC proxy — the premium justification for MSTR erodes
Gamma road map in this scenario: Below $142, the next meaningful support is the $140 strike (23.5M net GEX) — which also happens to be Leg 1 of today's trade. A break below $140 opens $135 and then $130. The Apr 17 $140 call (Leg 1) expires worthless if MSTR closes below $140 tomorrow.
💡 Trading Ideas
🛡️ Conservative — Wait for April 24 Clarity
Play: No new position before April 24. Watch how MSTR trades into the Bitcoin 2026 conference (April 27–29) and whether BTC can push above $78–80K to support a mNAV reexpansion.
Why this works:
- 🎯 The Apr 24 expiration date is binary — if BTC doesn't cooperate in the next 8 days, the $150 and $157.5 calls expire worthless regardless of the earnings story
- 💰 Post-April 24 IV crush will significantly reduce option premiums on May-dated contracts, offering better entry for an earnings play
- 📊 The $142 GEX support is very close to current price (~0.84% away) — if that breaks, the next floor at $140 only provides a modest cushion before the structure weakens further
Action plan:
- 👀 Watch BTC spot daily — $75K is the near-term line in the sand (above = constructive for mNAV; below = pressure)
- 🎯 If MSTR holds above $140 through April 24, consider a May-dated bull call spread ($145/$155) post-OPEX
- ❌ Do not chase the $157.5 lottery; odds are slim in an 8-day window
Risk level: Minimal | Skill level: Beginner-friendly
⚖️ Balanced — Apr 24 Bull Call Spread
Play: Buy the Apr 24 $145 call / Sell the Apr 24 $155 call (10-wide spread)
Why this works:
- 📊 Captures the $145–$150 move thesis (the whale's primary target zone) while capping cost with the short $155 call
- 🎯 Defined risk — maximum loss is the net debit paid (estimated $2.00–$3.00 per spread, or $200–$300 per contract)
- 🛡️ Breakeven around $147–$148, well within the gamma resistance zone at $145–$150
- 📅 Same April 24 expiration as Legs 2 and 3 of today's trade — aligns with the whale's timeline and the Bitcoin 2026 pre-conference window
Estimated P&L (approximate at current IVs):
- 💰 Net debit: ~$2.50/spread
- 📈 Max profit: $7.50/spread (200% return) if MSTR ≥ $155 by Apr 24
- 📉 Max loss: $2.50/spread if MSTR < $145 at expiration
- 🎯 Breakeven: ~$147.50
Position sizing: Risk 2–4% of portfolio maximum. This is a short-duration directional trade.
Risk level: Moderate | Skill level: Intermediate
🚀 Aggressive — Mirror the $150 Call (April 24)
Play: Buy Apr 24 $150 calls outright — mirroring Leg 2 of the whale trade (the leg with the 6.21 Z-score)
Why this is interesting:
- 🔥 The $150 call is the most anomalous leg of today's block — Z-score of 6.21, classified EXTREMELY UNUSUAL, volume at 4x open interest. The smart money flagged this strike as the high-conviction leg.
- 📈 If BTC moves toward $80K and mNAV stabilizes, MSTR at $150 by April 24 is plausible (approximately a 5% move)
- 🎰 At ~$3.18/contract, the call is priced for a relatively modest probability of success — leverage is real
Why this could go wrong:
- ⚠️ 8 days is a very short window. One flat day in BTC or a broader crypto risk-off move makes the $150 call nearly worthless
- 💸 Theta decay is significant with under 10 days to expiration — every day without movement costs premium
- ❌ This is pure speculation; the Z-score tells you the trade is unusual, not that it will be profitable
Estimated P&L:
- 💰 Cost: ~$3.18/contract ($318 per 1-lot)
- 📈 At $155 on April 24: call worth ~$5.00 → +57% gain
- 🚀 At $160 on April 24: call worth ~$10.00 → +215% gain
- 📉 Below $150 at expiration: total loss of $3.18/contract
IMPORTANT: Only allocate what you're prepared to lose in full. 8-day OTM calls on a volatile BTC proxy have a high probability of expiring worthless.
Risk level: High | Skill level: Advanced
⚠️ Key Risks
⚠️ Bitcoin is the single variable that controls everything. MSTR's average cost basis ($75,577/BTC) is already above current spot (~$73,800/BTC). If BTC reverses and retests the February lows near $60K, every analysis above becomes moot — the stock could revisit $104 and below, and all three of today's OTM calls expire worthless.
⚠️ The April 24 expiration is aggressive timing. For $150 and $157.5 strikes to pay off, MSTR needs to rally 5–10% in 8 trading days. That's plausible for a stock this volatile, but not a base-case outcome.
⚠️ mNAV at 1.20x has limited buffer. If mNAV compresses toward 1.0x (where MSTR = BTC NAV), the equity premium evaporates and the stock becomes a less efficient BTC proxy than an ETF. This structural risk is the long-term overhang on any MSTR long position.
⚠️ Analyst downgrades continue. The consensus price target has been slashed repeatedly — BTIG cut to $250, Canaccord to $185, Mizuho to $320. The low end of the analyst range ($131.30) is barely below current price — thin margin of safety for bulls.
⚠️ MSCI overhang is not closed. Bloomberg noted MSCI signaled a "broader, longer consultation" on non-operating companies. A negative ruling later in 2026 could force $10–15B in institutional selling.
⚠️ Preferred dividend obligations are growing. STRC at 11.5%, STRK at 8%, STRF at 10%, STRD at 10% — the preferred stack is increasingly capital-intensive. The $2.25B USD Reserve covers ~2.5 years under current conditions, but a prolonged BTC drawdown could compress that timeline.
🎯 The Bottom Line
Real talk: This is not a whale making a wild bet from scratch. It is a sophisticated, near-zero-cost restructure executed at the open by someone who already had a profitable position in the Apr 17 $134 call and chose to extend and upgrade rather than simply cash out.
The $7.5M collected on the $134 call sale essentially pays for all three of the new OTM positions. Net risk deployed today is nearly zero. What the trader is doing is swapping a deep-ITM, 1-DTE position for three higher-strike, longer-duration calls — increasing convexity and positioning for a continuation move above $145, $150, and $157.5.
The timing is pointed: April 24 expirations sit three days before the Bitcoin 2026 conference where Saylor speaks, and the full position ladder bridges toward the May 5 earnings date. This is calculated positioning across the two nearest-term catalysts, not random speculation.
If you own MSTR:
- ✅ The gamma structure shows strong support at $142 and $140 — a clean floor for short-term holders
- ✅ Watch BTC spot closely. $75–78K is the range where mNAV stability starts to matter again
- 📅 Mark April 27–29 (Bitcoin 2026 conference) and May 5 (Q1 earnings) as the two binary events that will define the next leg
If you're watching from the sidelines:
- ⏰ The best risk-adjusted window for a fresh position is post-April 24 OPEX and pre-May 5 earnings, when IV will partially reset and the Saylor conference outcome is known
- 🎯 Look for a hold above $140 as confirmation of the near-term bull case
If you're skeptical:
- 📊 mNAV at 1.20x approaching parity is the structural bear trigger to watch — not the daily BTC noise, but the slow erosion of the equity premium
- ❌ MSTR below $135 (losing the $135 gamma support) would be a meaningful technical signal that the base-building thesis has failed
This is a Bitcoin-sensitive macro trade dressed up in options structure. The whale knows exactly what they're doing — and the fact that the most unusual leg (Apr 24 $150, Z=6.21) points squarely at the pre-conference window tells you where they expect the move to happen.
Disclaimer: Options trading involves substantial risk of loss and is not suitable for all investors. This analysis is for informational and educational purposes only and does not constitute financial advice or a solicitation to buy or sell any security. All options positions described carry the risk of total loss of premium paid. MSTR is an exceptionally volatile stock tied to Bitcoin price movements; losses can be rapid and severe. Always conduct your own research and consult a licensed financial advisor before making any investment decision. Past performance of unusual options flow does not guarantee future results.