🚀 NVDA $88M Massive Long Call Stack at $195 — Whale Loads Up on Both May & July Calls Before May 20 Earnings
Date: May 6, 2026 | Ticker: NVIDIA Corporation (NASDAQ: NVDA) | Spot at Time of Trade: ~$205
The Quick Take
A single institutional player dropped $88 million in premium at 10:45:17 AM on May 6, simultaneously buying two legs of the same $195 strike call — one expiring May 15 (nine days out, straddling the May 20 earnings print) and one expiring July 17 (ten weeks out, capturing the full post-earnings window through Blackwell Ultra ramp season). Both legs arrived as BTO (Buy to Open) — fresh long premium paid, not a close or roll. This is a calendar-layered bull conviction trade, not a hedge, and $88 million in upfront premium is one of the largest single-session options bets on NVDA in 2026.
Tape Breakdown
| Date | Time | Exp | Strike | C/P | Vol | OI | Vol/OI | Premium | Order Type | Strategy |
|---|---|---|---|---|---|---|---|---|---|---|
| 2026-05-06 | 10:45:17 | Jul 17 2026 | $195 | CALL | 28,000 | 6,000 | 4.67x | $57,000,000 | BTO | Long Call |
| 2026-05-06 | 10:45:17 | May 15 2026 | $195 | CALL | 34,000 | 69,000 | 0.49x | $31,000,000 | BTO | Long Call |
Combined Premium Paid: $88,000,000
Both legs printed at the exact same timestamp — 10:45:17 — confirming a single coordinated entry, likely a multi-leg order routed simultaneously. The July leg (28K volume vs. 6K OI, Vol/OI = 4.67x) is an unambiguous new opening: volume nearly five times open interest means this contract barely existed before the trade hit. The May leg (34K volume vs. 69K OI, Vol/OI = 0.49x) looks more ambiguous on the ratio alone, but the same-second BTO designation from the order-flow classifier confirms this is a fresh long opening — not a seller closing an existing short.
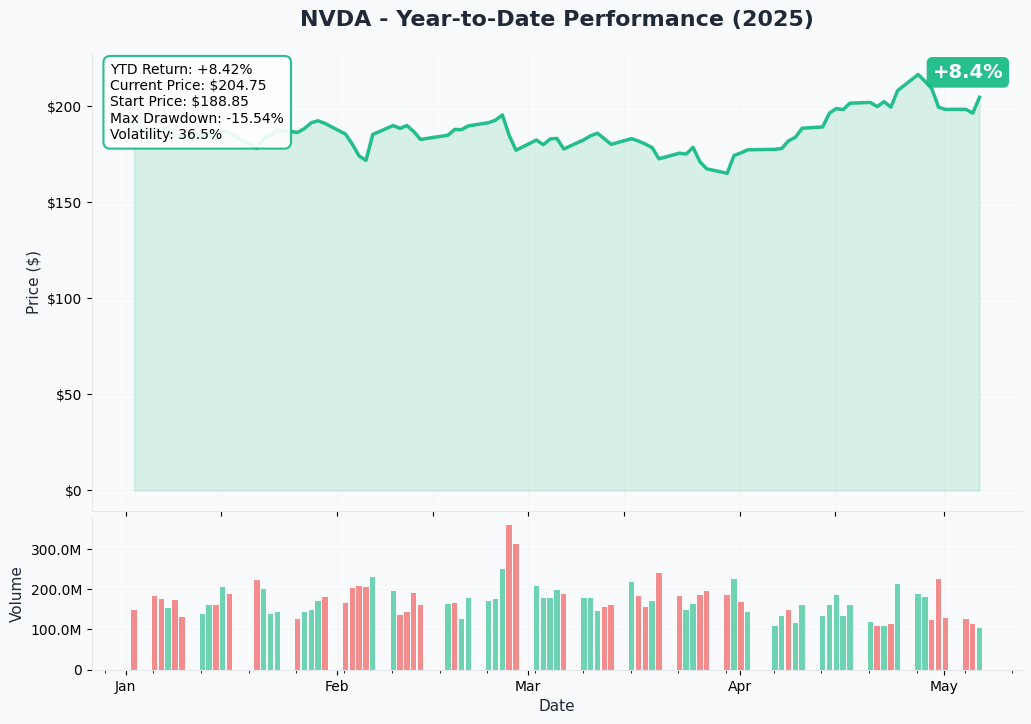
YTD Chart
📈 Gamma-Based Support & Resistance
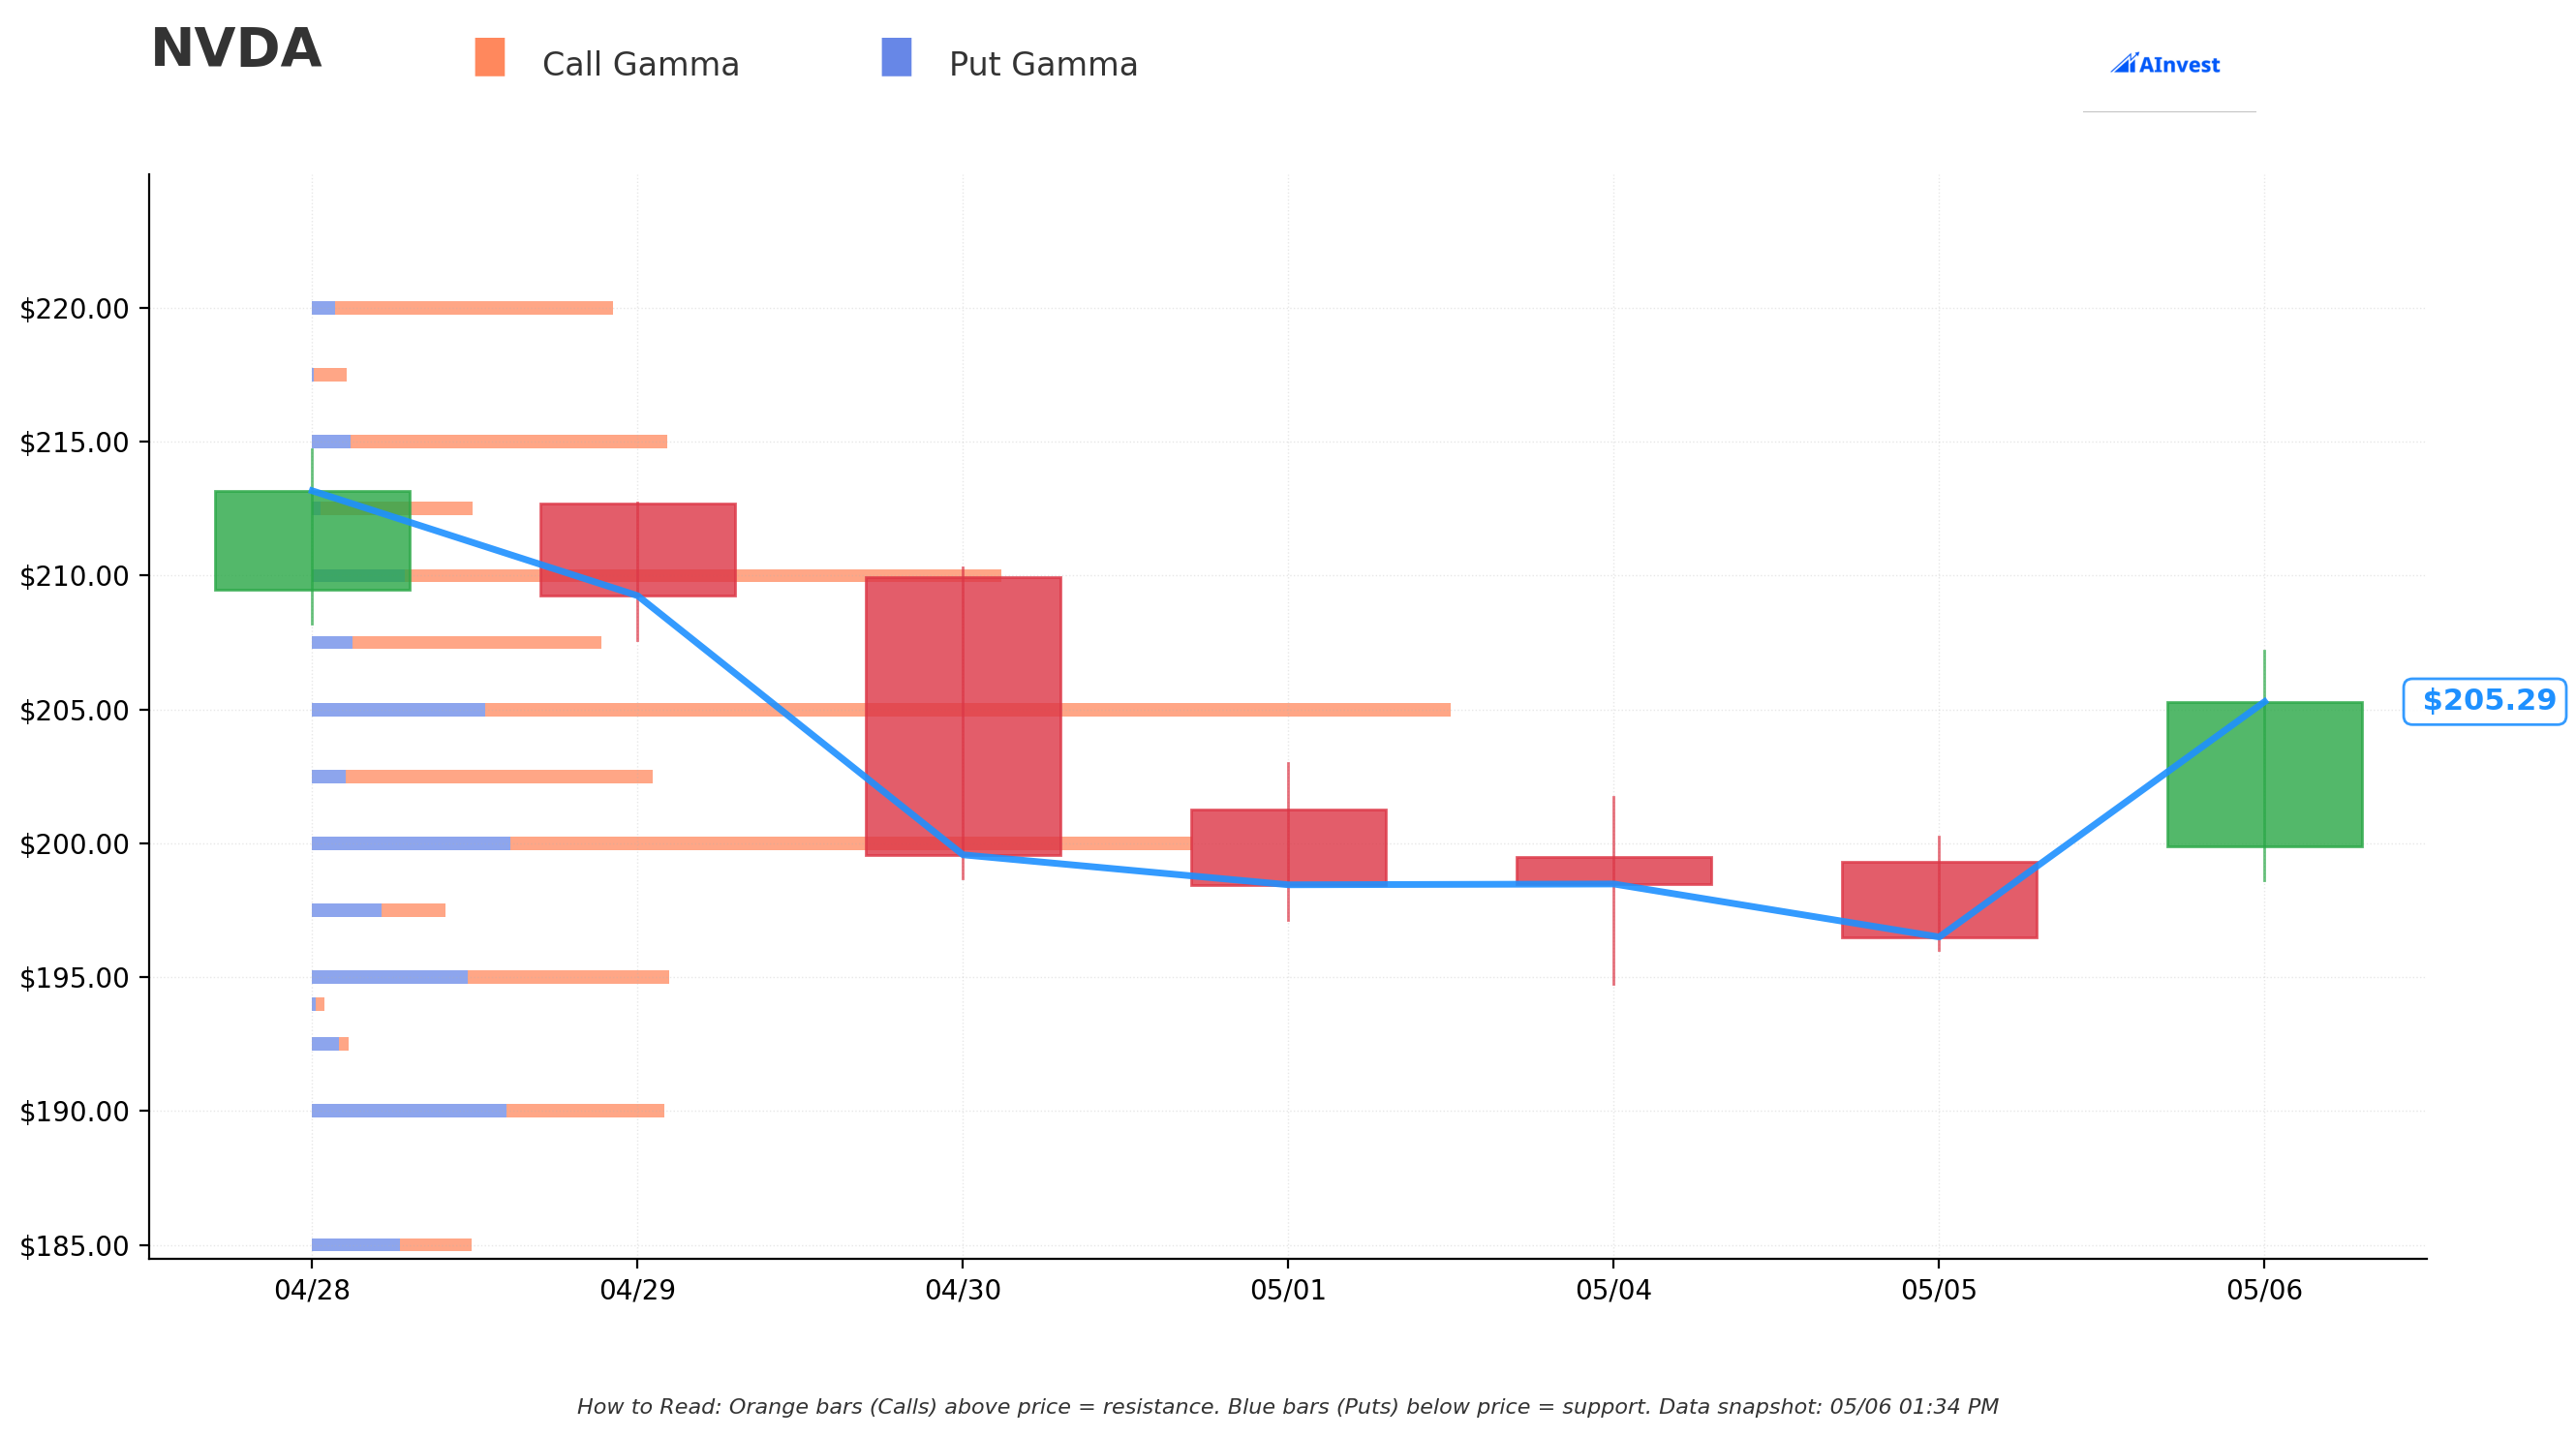
Current Price: $205.68
🔵 Support levels (GEX-based dealer zones):
- $205.00 — net GEX +221.06M, 0.33% below spot ($205.68)
- $202.50 — net GEX +70.72M, 1.55% below spot ($205.68)
- $200.00 — net GEX +130.89M, 2.76% below spot ($205.68)
- $195.00 — net GEX +13.13M, 5.19% below spot ($205.68)
- $190.00 — net GEX -10.27M, 7.62% below spot ($205.68)
🟠 Resistance levels (GEX-based dealer zones):
- $207.50 — net GEX +65.68M, 0.88% above spot ($205.68)
- $210.00 — net GEX +146.92M, 2.10% above spot ($205.68)
- $215.00 — net GEX +81.73M, 4.53% above spot ($205.68)
- $220.00 — net GEX +74.90M, 6.96% above spot ($205.68)
With spot at $205.68, the closest GEX wall above is $207.50 (0.88% away) and the closest gamma floor below is $205.00 (0.33% away). Dealers are positioned to dampen volatility around these levels in normal flow.
🎯 Implied Move Analysis
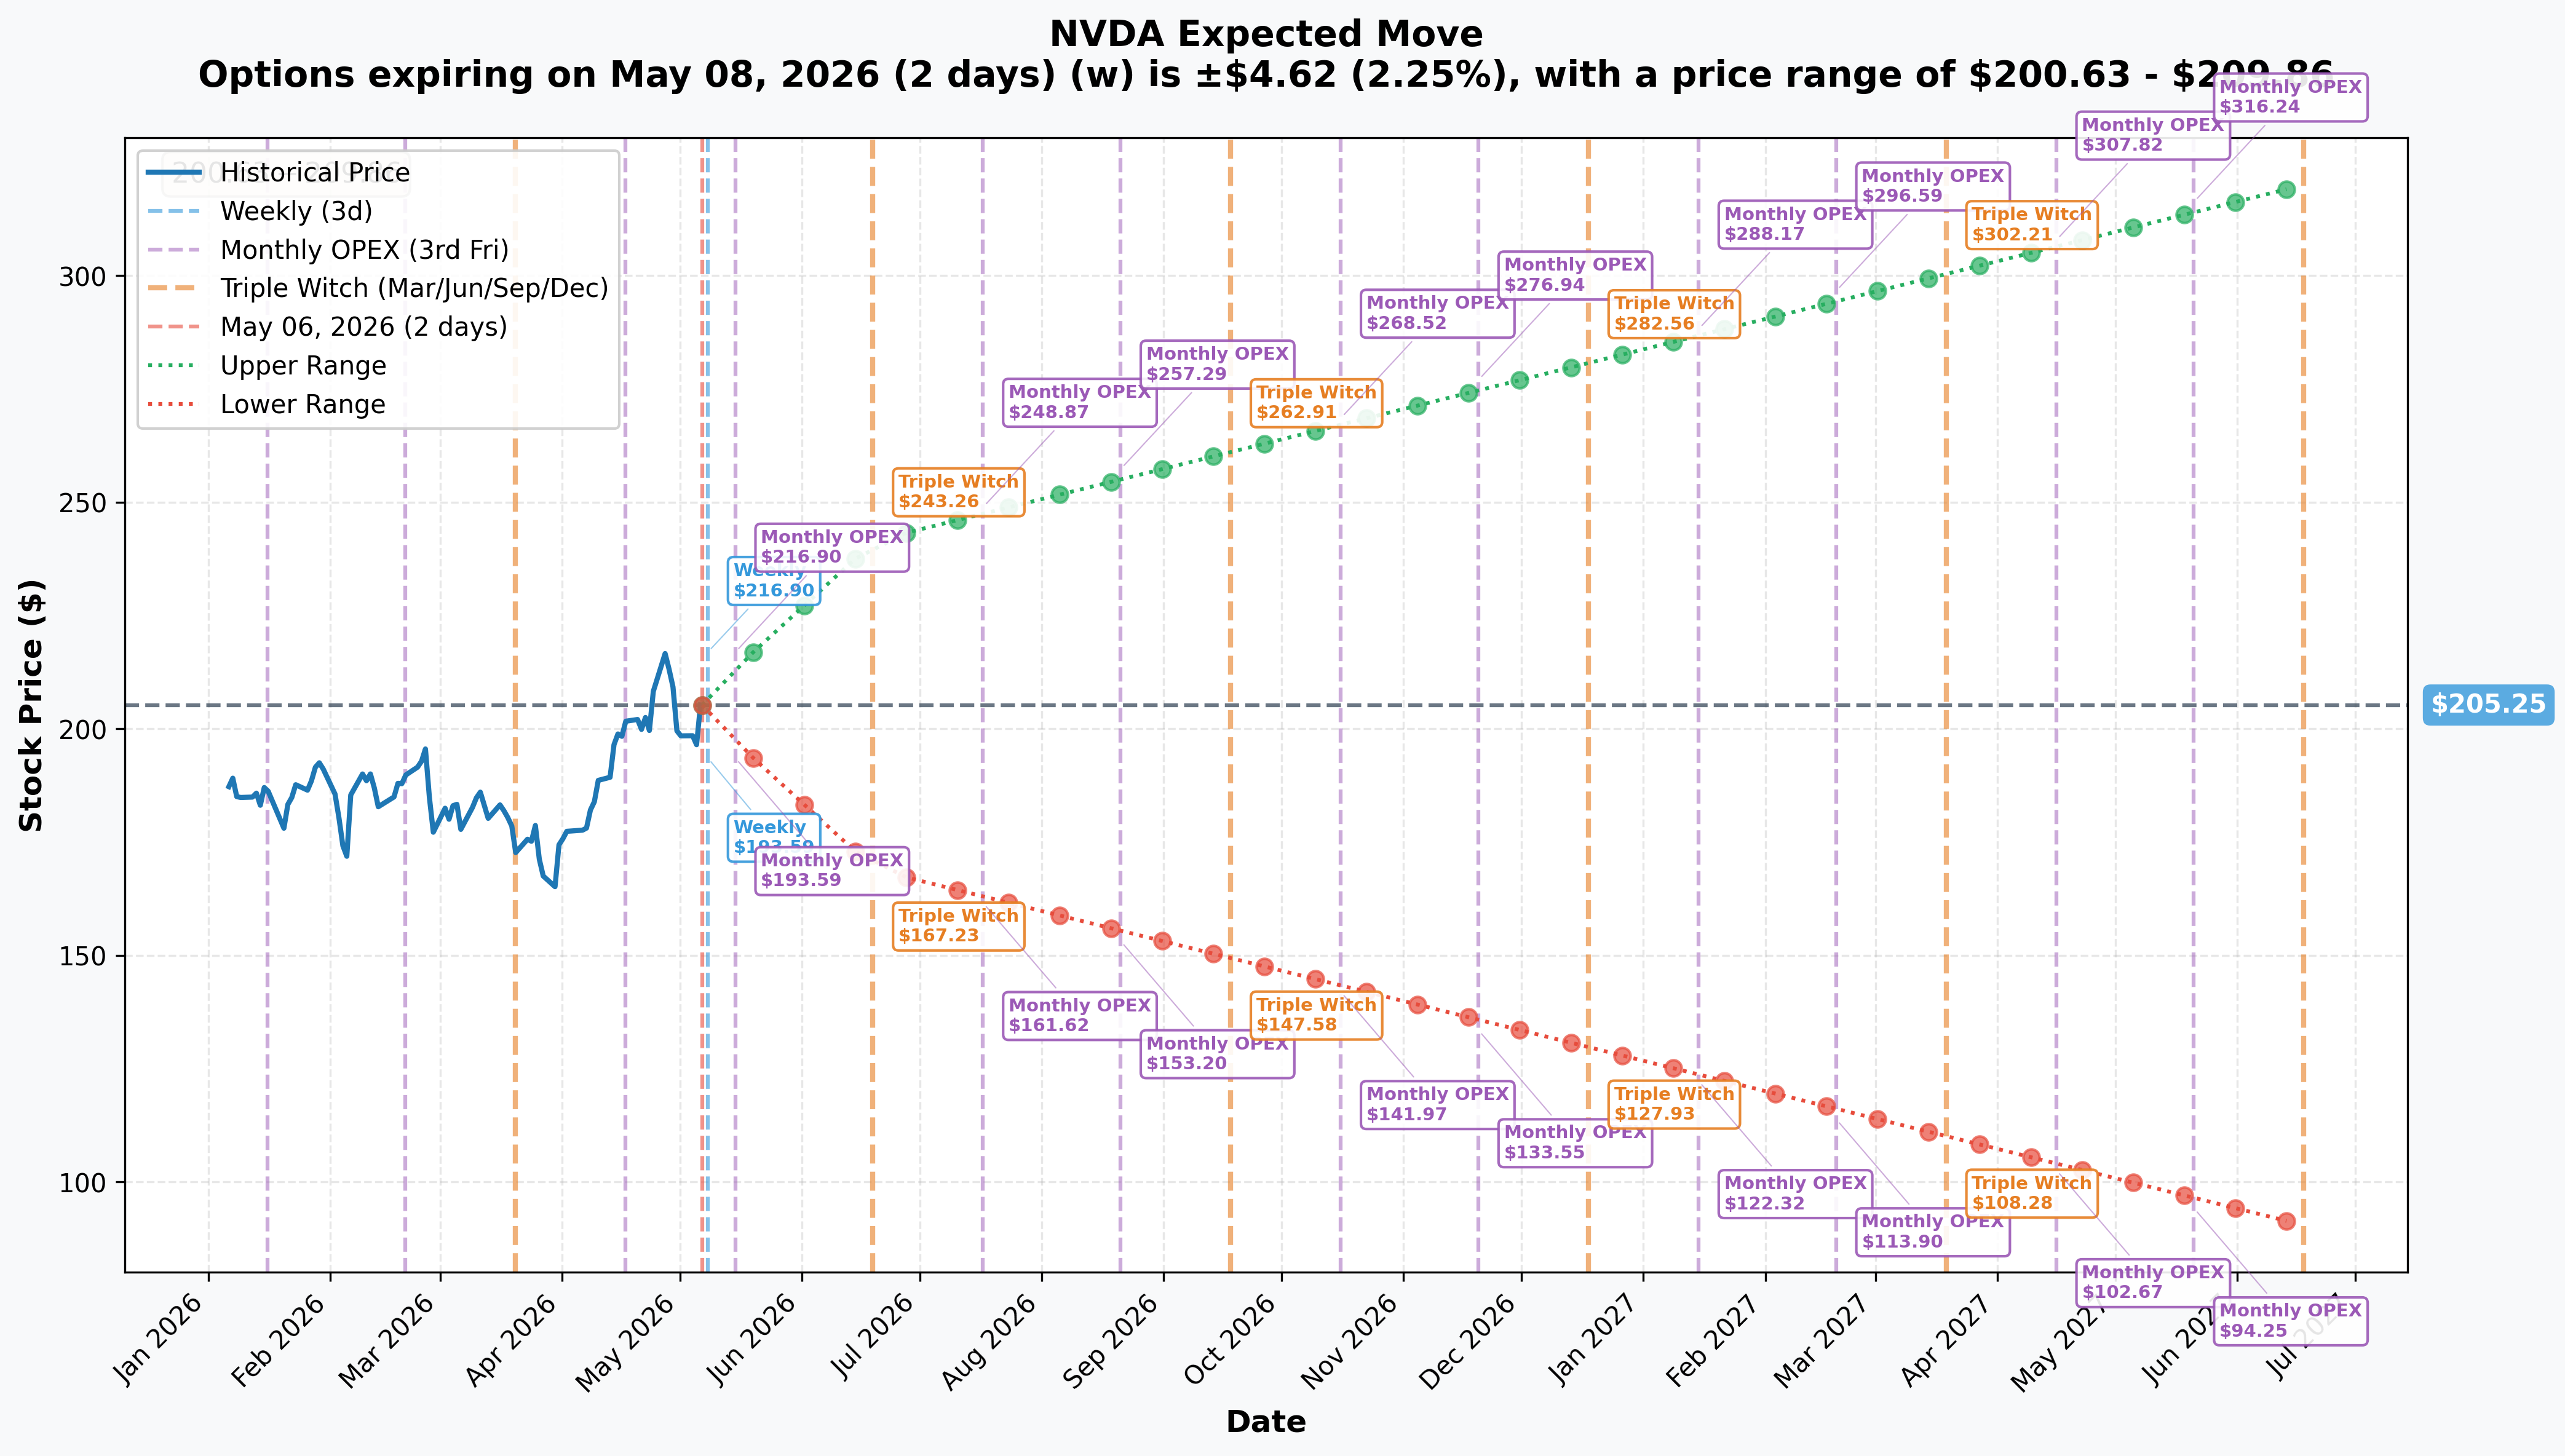
Options market pricing from ~$205.25:
| Expiry | Type | Days | Implied Move | Range |
|---|---|---|---|---|
| 2026-05-08 | Weekly | 2 | ±2.25% / ±$4.62 | $200.63 – $209.86 |
| 2026-05-15 | Monthly OPEX | 9 | ±4.13% / ±$8.48 | $196.77 – $213.72 |
| 2026-06-19 | Quarterly (Triple Witch) | 44 | ±17.68% / ±$36.28 | $168.96 – $241.53 |
| 2027-06-18 | Yearly LEAPS | 408 | ±55.98% / ±$114.89 | $90.36 – $320.13 |
These ranges represent one-standard-deviation moves implied by ATM straddle prices. Roughly 68% of historical outcomes fall inside the band — meaning ~1 in 3 expirations break out of the range. Use these as guideposts, not guarantees.
Note: Gamma exposure (GEX) and implied move charts are not available for this session.
Strategy Anatomy: Calendar-Loaded Long Call Stack
Why Two Expirations at the Same Strike?
When a single buyer purchases calls at the same strike across two different expirations simultaneously, the structure is typically one of three things:
- Calendar spread (if the near-term leg is sold and the far-term leg is bought) — that is NOT what happened here. Both legs are BTO / long.
- Scaling into a view across the term structure — the buyer wants exposure both through the near-term catalyst (earnings May 20) and across the longer runway (Blackwell Ultra ramp through July).
- Conviction sizing — the position is so large that routing it all into a single expiration would move the market. Splitting across two expirations diversifies execution slippage and liquidity impact.
Given the BTO classification on both legs and the exact same timestamp, this reads as aggressive scaling — the buyer is not trying to offset the May leg with July; they want premium in both windows. The May 15 leg expires five days after the May 20 earnings print, meaning it captures zero post-earnings time value — it lives or dies entirely on the pre-earnings run and immediate reaction. The July 17 leg gives the position 10 weeks to work, weathering any near-term earnings noise while capturing the Blackwell Ultra shipment cadence and the Vera Rubin deployment narrative through summer.
Position Economics
| Leg | Premium Paid | Contracts (est.) | Notional Exposure |
|---|---|---|---|
| Jul 17 $195C | $57,000,000 | ~2,800 | ~$574M delta-equiv at ~1.0 delta for ITM calls |
| May 15 $195C | $31,000,000 | ~3,400 | ~$700M delta-equiv at ~1.0 delta for ITM calls |
| Total | $88,000,000 | ~6,200 | ~$1.27B notional delta at full delta |
Contracts estimated as volume / 10 (standard 100-share multiplier).
With NVDA spot at ~$205 and the strike at $195, both calls are approximately 5% in-the-money at entry. ITM long calls carry high delta (likely 0.85–0.95 for May, 0.75–0.85 for July given time value) and minimal extrinsic premium relative to deep OTM structures. This is not a lottery ticket. It is a high-conviction directional bet where the buyer is paying for intrinsic + time value on a stock they expect to continue moving higher.
Breakeven and Payoff Analysis
Blended Breakeven
Calculating a precise per-contract blended cost requires knowing the exact fill prices, which are estimated from total premium and volume:
- July leg implied per-contract premium: $57,000,000 / 2,800 contracts = ~$20.36 per contract = $2,036 per 100 shares
- May leg implied per-contract premium: $31,000,000 / 3,400 contracts = ~$9.12 per contract = $912 per 100 shares
At a $195 strike:
- July breakeven: $195 + $20.36 = ~$215.36
- May breakeven: $195 + $9.12 = ~$204.12
The May leg is nearly at-the-money on a breakeven basis with NVDA at ~$205 — the position is only fractionally profitable on that leg as of entry. The July leg requires a further rally to ~$215 for breakeven, approximately 5% above the May 6 spot.
Blended breakeven across $88M total premium (weighted by premium paid):
- (57/88 × $215.36) + (31/88 × $204.12) = $139.51 + $71.90 = ~$211.41
The position profits in aggregate when NVDA is above roughly $211 at expiration of the respective legs. For the July leg specifically, profitability requires a sustained move and hold above $215 by mid-July.
Maximum Loss
Full $88,000,000 in premium paid. Long options cannot lose more than the premium paid — there is no margin call risk, no uncapped loss. However, losing $88 million is not a trivial outcome; it requires NVDA to close below $195 at both expirations, implying a ~5% decline from the May 6 entry spot.
Maximum Profit
Theoretically unlimited to the upside. NVDA would need to trade substantially above $215–$216 for the position to generate meaningful returns on an $88M cost basis. At $230 by July expiration, for example, the July calls alone would be worth ~$35 per share ($3,500 per contract x 2,800 contracts = ~$9.8B intrinsic + remaining time value), representing a massive multiple on the $57M July leg premium.
Context: Why $195 Calls? Why Now?
Spot Price and Strike Selection
At ~$205 spot on May 6, the $195 strike sits roughly $10 in-the-money — approximately 5% ITM. This is a deliberate strike selection for a buyer who wants high delta exposure without paying the full stock price. ITM calls behave more like leveraged stock than a speculative OTM bet. The buyer is not trying to triple their money on a surprise move; they are trying to replicate long stock exposure with defined maximum loss ($88M cap) and substantially lower capital outlay than buying 6,200 contracts worth of underlying stock directly.
The $195 strike also holds technical significance: NVDA's all-time closing high was $216.61 on April 27, 2026, and the stock had pulled back roughly 9% into the May 6 entry. The $195–$205 range represents a well-defined support zone from the April consolidation. Buying calls at $195 ITM means the buyer is essentially wagering that NVDA does not give back all of its recent gains AND that the May 20 earnings catalyst provides a fresh catalyst to retest and exceed the $216 ATH.
The May 20 Earnings Catalyst
NVIDIA's Q1 FY27 earnings print on May 20, 2026 is the most concentrated near-term catalyst. Management guided to $78B revenue — already a +77% YoY figure — but the Street consensus sits at $80.07B, meaning analysts already expect a beat-and-raise.
Key metrics the options market will be watching:
- Data Center revenue mix: Q4 FY26 delivered $62.3B in Data Center alone per NVIDIA's official Q4 FY26 release. Continuation at that level or acceleration into Q1 is the bull trigger.
- Gross margin trajectory: Street looking for 75%+ GAAP; any compression below 74% from Blackwell Ultra ramp costs would be a headwind.
- Q2 FY27 guide: This matters more than the Q1 print. A Q2 guide above $85B would confirm that Blackwell Ultra is ramping without air pockets. A guide at $78–80B (in-line) could trigger a "beat baked in" sell-off.
- China commentary: Zero H200 shipments as of late February 2026 per Bloomberg (Feb 26, 2026). Any update on the ~82,000-unit H200 pipeline per Tom's Hardware would move the stock.
The May 15 call expiration falls five days before the print. This structure captures any pre-earnings IV expansion and an implied run-up but NOT the post-earnings move. The buyer is either: (a) planning to sell the May leg before earnings to capture theta/vega appreciation, OR (b) comfortable losing the May leg entirely if NVDA stays flat into the print.
The Bull Case: Why This Trade Could Work
1. Blackwell Ultra GB300 Ramp — +129% YoY Unit Growth
Blackwell Ultra GB300 shipments are projected to grow +129% YoY in 2026, with roughly 60,000 racks expected to ship. Microsoft Azure has already deployed the first large-scale GB300 NVL72 cluster for OpenAI workloads, serving as a proof-of-concept that the supply chain is operational. Revenue recognition on these systems flows directly into Q1 and Q2 FY27 data center results — this is the single largest near-term revenue driver.
2. Vera Rubin — 2H 2026 Commercial Launch
Jensen Huang confirmed Vera Rubin in full production at GTC 2026 in March, with AWS, Google Cloud, Microsoft Azure, OCI, CoreWeave, Lambda, and others slated for first commercial instances in 2H 2026 per NVIDIA's Rubin newsroom post and Tom's Hardware's CES live coverage. Rubin claims 5x inference performance and 3.5x training throughput versus Blackwell, making it the generational step-change that justifies continued hyperscaler upgrade cycles. The July 17 expiration sits squarely in the window where Vera Rubin partner deployment announcements become possible catalysts.
3. OpenAI 1GW Rubin Deployment Trigger
The NVIDIA-OpenAI 10GW / $100B strategic partnership structures the first gigawatt of Vera Rubin deployment as a milestone tied to a $10B NVIDIA equity stake in OpenAI. This creates a hard deadline incentive for both parties to execute on the 2H 2026 timeline, and any public confirmation of that first 1GW delivery would likely be a significant stock catalyst.
4. $725B Hyperscaler Capex Cycle — Structural Demand Floor
The four major hyperscalers confirmed aggregate CY2026 capex of approximately $725B across their Q1 2026 earnings calls, per Yahoo Finance/Fortune's compilation:
- Amazon: ~$200B
- Google: $180–190B (CFO confirmed "significant increase" planned for 2027)
- Microsoft: ~$150B annualized run-rate
- Meta: $125–145B (raised guidance twice at both ends)
Roughly 75% of this total — approximately $545B — is directed at AI-specific GPU, server, data center, and power infrastructure per Futurum's capex analysis. NVIDIA, capturing ~87% AI accelerator market share entering 2026, is structurally positioned to absorb the largest share of this spend. The scale of committed hyperscaler capital provides a demand floor that is difficult to dislodge in a single earnings cycle.
5. Analyst Consensus: $270 Average, $325 Bull Case
Per MarketBeat's analyst consensus tracker and 24/7 Wall St.'s coverage, 51 of 53 analysts rate NVDA a Buy with a $270.25 average 12-month price target — approximately 37% upside from the May 6 spot. Rosenblatt carries a $325 PT; Raymond James raised to $323; Cantor Fitzgerald and Bernstein both hold $300. Zero downgrades in the trailing six months. The analyst community is providing a durable sentiment backstop.
The Bear Case: What Could Derail This Trade
1. AMD–Meta MI450 Deal — First Real Defection
The $60B / 6GW AMD–Meta MI450 partnership announced February 24, 2026 is qualitatively different from prior AMD wins. Meta is a hyperscaler-scale customer committing to a flagship workload — not an edge case or secondary deployment — and AMD is offering Meta warrants to take ~10% AMD equity if both sides deliver, per Techi's analysis. First 1GW deploys in 2H 2026. If AMD's MI450 performance benchmarks prove competitive with Blackwell Ultra in inference at scale, the narrative around NVIDIA's monopoly pricing power shifts materially.
2. Anthropic's $200B Google TPU Commitment
Anthropic committed to $200B in Google Cloud spending (reported May 5, 2026), with access to up to 1 million Google TPU chips and 5GW of compute capacity as part of Google's up-to-$40B investment in Anthropic announced April 24, 2026. This is not a small substitution — it moves a frontier AI lab with multi-hundred-billion dollar training and inference demand off NVIDIA's GPU ecosystem and onto TPUs. It validates that Google's internal TPU program has matured to production-grade quality for leading model developers.
3. China Revenue Overhang
China's share of NVIDIA's AI accelerator revenue collapsed from approximately 66% in late 2024 to roughly 8% by early 2026, per Tom's Hardware's detailed analysis. The ~82,000 H200 units staged for China delivery remain stuck in regulatory limbo — subject to 25% tariffs, U.S. third-party inspection requirements, and a 50% domestic volume cap per CRN Asia. Any further export restriction tightening wipes out the H200 China optionality entirely.
4. Insider Distribution Signal
NVIDIA insiders disposed of $450M+ in stock via Form 4 filings between December 2025 and March 2026, per Techi. Jensen Huang has cumulatively sold approximately $2.9B+ via 10b5-1 systematic plans since mid-2024. March 20, 2026 alone saw 25 insider sale transactions totaling $46.9M per MarketBeat's insider tracker. While 10b5-1 plans are pre-scheduled and legally benign, the sustained volume of distribution at current prices is a persistent sentiment headwind that limits multiple expansion.
5. "Beat Baked In" Earnings Risk
The Street already assumes approximately 79% YoY revenue growth for Q1 FY27 above management's $78B guidance. Per TIKR's pre-earnings analysis, an in-line print with $78B — even a beat to $80B — may not be sufficient for a meaningful post-print rally if Q2 guidance is merely reiterated rather than materially raised. NVDA has already pulled back roughly 9% from its April 27 ATH of $216.61, pricing in some skepticism, but a $4.8T market cap on a stock with earnings consensus already at $80B leaves limited room for positive surprise without a Q2 blowout guidance.
Volatility Considerations
The options market was pricing approximately a 7–8% implied move into the May 20 print based on prevailing at-the-money straddle prices, per the catalyst research. This implies the market expects a move of roughly $14–$16 off the ~$197–205 range — a post-earnings move to either $211–221 (upside) or $181–191 (downside).
Key IV observations for this trade:
- The May 15 leg expires BEFORE earnings can be reflected in the options price — the May 15 calls settle based on the May 15 close, not the May 20 print. This means the May leg benefits from IV expansion as earnings approach, but the buyer does not capture post-earnings resolution on this leg unless they roll or hold through the Friday close.
- The July leg captures full IV expansion and post-earnings resolution. If NVDA gaps up 10%+ on May 20, the July $195 calls would be deeply ITM and richly bid — that leg is the primary earnings-capture vehicle.
- IV crush risk on May leg: If the buyer holds the May 15 calls through May 15 expiration with the stock near $195–200, the IV compression into a quiet pre-earnings window (May 15 is nine days before the print) could erode extrinsic value on that leg even if the stock holds steady.
Three Trading Ideas
Idea 1 — Replicate the Whale: Buy NVDA Jul 17 $195 Calls (High Conviction, Long Premium)
Rationale: The July 17 expiration provides 10+ weeks of runway through the May 20 earnings print, Blackwell Ultra ramp news flow, and early Vera Rubin deployment announcements. With Vol/OI of 4.67x, this contract is clearly opening new interest. The position is ~5% ITM, meaning a significant portion of the premium is intrinsic rather than speculative time value — the position doesn't require a major additional rally to have value.
Setup: BTO Jul 17 $195 Call. Suggested position sizing: 1–5 contracts for retail, scaled to where max loss (full premium paid) represents 1–3% of portfolio.
Target exit: Sell at 50–100% premium gain if NVDA rallies to $215–225 ahead of earnings, or hold through earnings if the position is already profitable and the July time premium justifies continued exposure.
Key risk: Full premium loss if NVDA trades below $195 at July expiration. Earnings disappointment is the primary scenario where this occurs — a "beat baked in" reaction that sends NVDA to $175–185 would result in significant loss on this leg.
Idea 2 — Defined Risk Earnings Play: Bull Call Spread Jul 17 $205/$225 (Moderate Conviction, Lower Cost)
Rationale: Rather than paying the full premium for ITM calls, a $205/$225 call spread reduces the net debit significantly while still providing leveraged upside if NVDA rallies 10%+ from current levels to approach or exceed the $216 ATH. The spread structure caps maximum gain but also caps maximum loss to the net debit paid — appropriate sizing for earnings-binary events.
Setup: BTO Jul 17 $205 Call / STO Jul 17 $225 Call. Net debit likely $6–9 per share (estimate; depends on live market pricing). Maximum profit at $225 or above = $20 minus net debit = $11–14 per share. Maximum loss = net debit paid.
Breakeven: Approximately $211–214 depending on fill prices — consistent with the whale's blended breakeven thesis.
Key risk: NVDA must rally above the breakeven by July expiration. If the stock gaps down on earnings and stays suppressed, the full debit is lost. Importantly, this structure is not affected by IV crush as severely as a naked long call — the short upper leg partially hedges vega.
Idea 3 — Pre-Earnings IV Play: Sell May 15 / Buy Jun 20 Calendar Spread at $200 (Neutral-to-Bullish, Volatility Arbitrage)
Rationale: The May 15 expiration carries elevated implied volatility from earnings anticipation, even though it expires before the print. A calendar spread — sell the May 15 $200 call (high IV, burns fast) and buy the June 20 $200 call (lower IV, captures post-earnings resolution) — monetizes the IV term structure premium without requiring a large directional move. This is a different posture than the whale trade: it profits if NVDA stays in a range ($195–215) while IV normalizes after the May 15 expiry.
Setup: STO May 15 $200 Call / BTO Jun 20 $200 Call. Net debit = the calendar premium (cost of June call minus credit from May call). Maximum profit occurs if NVDA closes near $200 at May 15 expiry and IV remains elevated in the June leg.
Key risk: A sharp rally above $215 before May 15 would cause the short May call to appreciate faster than the long June call, creating a loss. This structure is best suited for traders who believe NVDA churns sideways into May 15 before a larger move after earnings.
Risk Disclosures
Options trading involves substantial risk and may result in the loss of the entire premium paid. The strategies discussed in this analysis are presented for informational and educational purposes only and do not constitute personalized investment advice. Past options activity, even large institutional trades, does not predict future stock performance. Large block trades can represent hedging activity, portfolio rebalancing, or complex multi-leg positions that are not visible from a single trade printout — what appears to be a pure directional bet may be one leg of a more complex institutional structure.
The $88M premium paid on these two legs represents a maximum loss scenario that requires NVDA to close below $195 at both expirations. At a spot of ~$205, a 5% decline from entry would reduce the position to at-the-money or slightly OTM status, significantly impairing both legs. A 10%+ post-earnings sell-off (stock to $185) would render both positions essentially worthless.
Retail traders should size positions to where the maximum loss scenario (full premium) represents a small, pre-defined fraction of their trading account. Never allocate more capital to a long options position than you can afford to lose entirely.
Options analysis prepared May 6, 2026. All catalyst data sourced inline. Spot price reference ~$205 (intraday May 6, 2026). Premium figures sourced from trade tape. Breakeven calculations are estimates based on inferred per-contract costs. Live Greeks and live implied volatility data not available for this session.