🔥 RGTI: $14M Call Sale Signals Institutional Profit-Taking on Quantum High-Flyer!
📅 September 19, 2025 | 🔥 Unusual Activity Detected
🎯 The Quick Take
Someone just dumped $14 MILLION worth of RGTI calls right at the money - that's the kind of institutional selling that makes you sit up and pay attention! With the stock up 44% YTD and approaching September expiration, this whale is cashing out their chips after a massive quantum computing rally that took RGTI from $20 to nearly $29 in just weeks.
🏢 Company Overview
Rigetti Computing Inc is a quantum computing pioneer building the future of computing:
- Market Cap: $8.0 billion
- Industry: Computer Programming Services
- Core Business: Full-stack quantum computing platform delivered via cloud service through Rigetti QCS
- Employees: ~140
- YTD Performance: +44.25% (currently $28.85)
💰 The Option Flow Breakdown
📊 What Just Happened
| Time | Symbol | Side | Buy/Sell | C/P | Expiration | Premium | Strike | Volume | OI | Size | Spot | Option Price |
|---|---|---|---|---|---|---|---|---|---|---|---|---|
| 11:05:16 | RGTI | BELOW BID | SELL | CALL | 2025-09-26 | $14M | $23 | 30K | 70K | 28,731 | $27.5 | $4.85 |
| 11:05:16 | RGTI | BELOW BID | SELL | PUT | 2025-09-26 | $2.9M | $25 | 31K | 2.3K | 28,731 | $27.5 | $1.02 |
| 11:05:16 | RGTI | BELOW BID | SELL | PUT | 2025-09-26 | $460K | $20 | 30K | 69K | 28,731 | $27.5 | $0.16 |
| 11:05:16 | RGTI | BELOW BID | SELL | CALL | 2025-09-26 | $4.3M | $29 | 29K | 712 | 28,731 | $27.5 | $1.48 |
Option Symbols:
- RGTI+20250926+C+00002300 - View Option Chart
- RGTI+20250926+P+00002500 - View Option Chart
- RGTI+20250926+P+00002000 - View Option Chart
- RGTI+20250926+C+00002900 - View Option Chart
🤓 What This Actually Means
Real talk: This is textbook profit-taking behavior! Let me break this down:
- 💰 Total Premium Collected: $21.66 million across 120,000+ contracts
- 🎯 Strike Concentration: Average strike of $24.20 vs spot price of $27.50
- 📉 Execution Below Bid: ALL trades filled below bid = aggressive selling pressure
- 🐋 Size Context: 28,731 contracts per leg = controlling 2.87 million shares worth $79 million
- ⏰ Time to Expiry: Just 7 days until September 26 expiration
Translation for us regular folks: This whale just executed a massive closing trade, selling deep in-the-money calls ($23 strike when stock at $27.50) and puts to collect $21.66M in premium. That's like seeing the smart money head for the exits after a 44% rally - time to pay attention! 👀
📈 Technical Setup / Chart Check-Up
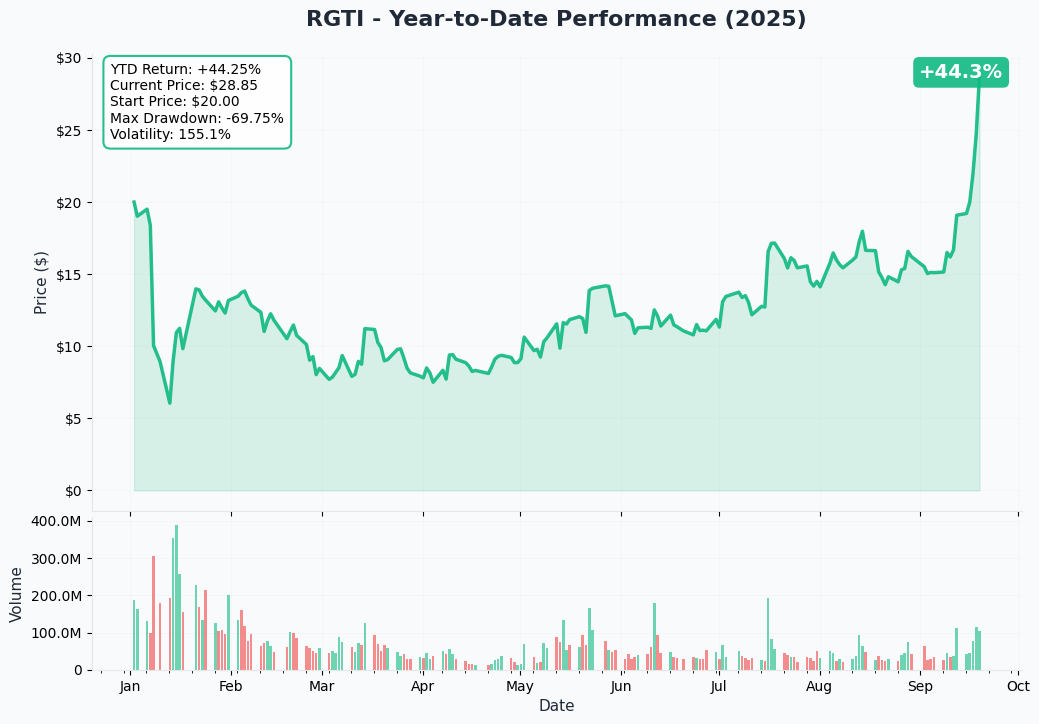
Looking at the YTD chart, RGTI has been on an absolute tear:
- YTD Return: +44.3% (crushing the broader market)
- Recent Surge: Explosive move from $15 to $28 in September
- Key Support: $20 level (previous resistance now support)
- Current Level: $28.85 - testing recent highs
- Max Drawdown: -69.75% (massive volatility)
- Volatility: 155.1% (extremely high even for quantum stocks)
The stock exploded higher in late August/early September with multiple 300M+ volume days. This vertical move is exactly the kind of parabolic action that triggers profit-taking from smart money.
🎪 Catalysts
📅 Upcoming Events
- November 11, 2025: Q3 2025 Earnings - Critical update on quantum roadmap progress
- End of 2025: 100+ qubit system target - Major technical milestone
- 2026: 336-qubit Lyra™ system development
🔥 Recent Developments
- July 2025: Achieved 99.5% two-qubit fidelity - triggered 30% stock surge
- $5.8M Air Force Contract: Three-year quantum networking project with QphoX
- Quanta Partnership: $250M combined investment over five years
- 36-qubit Cepheus-1: Already achieved mid-2025 target ahead of schedule
🎲 Price Targets & Probabilities
Based on Wall Street consensus of $17.43 (yes, below current price!) and recent volatility:
🚀 Bull Case ($35+ by October) - 25% chance
- Positive Q3 earnings surprise with contract announcements
- Breakthrough in quantum fidelity or qubit count
- Additional government contracts or enterprise partnerships
- Short squeeze potential with high short interest
😐 Base Case ($22-28) - 50% chance
- Consolidation after massive rally
- Normal profit-taking and volatility
- Awaiting Q3 earnings for next catalyst
- Range-bound trading in current zone
😰 Bear Case ($15-20) - 25% chance
- Mean reversion after 44% YTD gain
- CEO Kulkarni selling 1M shares for $12M
- Reality check on 3-4 year timeline to quantum advantage
- Competition from IonQ, D-Wave, and other quantum players
💡 Trading Ideas
🛡️ Conservative: "Wait for the Dust to Settle"
Stay on sidelines or take profits if holding
- Massive institutional selling suggests near-term top
- Wait for support test at $20-22 level
- Consider buying shares on 20%+ pullback
- Set alerts for $22 (support) and $20 (major support)
⚖️ Balanced: "Volatility Harvest"
Sell RGTI Oct $30 Covered Calls (if you own shares)
- Collect premium while stock consolidates
- Strike above recent highs provides upside room
- Use premium to reduce cost basis
- Exit if stock breaks below $25
🚀 Aggressive: "Fade the Rally"
Buy RGTI Oct $25 Puts (currently ~$2.50)
- Play the mean reversion after parabolic move
- Risk only $250 per contract
- Target $20 support for 100% gain potential
- Stop loss if stock breaks above $32
⚠️ Risk Factors
Let's keep it real - here's what could go wrong:
- 📉 Valuation Disconnect: Trading 60% above analyst targets
- 🔬 Technology Risk: Quantum advantage still 3-4 years away
- 💸 Cash Burn: $164.83M trailing losses despite government contracts
- 🎢 Extreme Volatility: 155% implied volatility means wild swings
- 🏃 Insider Selling: CEO and insiders taking profits at these levels
- 🤝 Competition: IonQ showing stronger private sector traction
🎯 The Bottom Line
Here's the deal: When someone dumps $14 million in calls right after a stock runs up 44%, that's not gambling - that's profit-taking from someone who rode this quantum wave perfectly. This whale is essentially saying "thanks for the ride, but I'm out at $28!"
The Action Plan:
✅ If you own RGTI: Consider taking some chips off the table - follow the smart money
✅ If you're watching: Wait for a pullback to $20-22 before entering new positions
✅ If you're bearish: The October $25 puts offer attractive risk/reward for a mean reversion play
Mark your calendar for November 11th - that's when Q3 earnings will either justify this $8 billion valuation or trigger a reality check. With the stock trading 60% above analyst targets and massive insider selling, this looks more like a "sell the news" setup than a breakout.
Remember: Quantum computing is revolutionary technology, but revolutionary doesn't always mean profitable. This whale just showed us that sometimes the best trade is knowing when to take your profits and run! 💪
Options involve risk and are not suitable for all investors. This analysis is for educational purposes only and not investment advice. Always do your own research and consult with a financial advisor.