🛍️ ROST Long Call - $663K Value Retail Bet!
📅 December 11, 2025 | 🔥 EXTREMELY UNUSUAL Activity Detected
🎯 The Quick Take
Someone just dropped $663K on ROST May 2026 $200 calls in a massive buy-to-open order! This institutional whale is betting on a 9.5% rally from $182.58 to $200 over the next 5 months - a bold but achievable target for the red-hot off-price retailer. With a Z-Score of 121.63 flagged as "EXTREMELY_UNUSUAL", this trade is 121 standard deviations above normal ROST flow. Translation: This is not normal. Someone with serious conviction just placed a massive bet that Ross Stores is heading to new all-time highs through the critical holiday season and into 2026!
📊 Company Overview
Ross Stores Inc. (ROST) is the second-largest off-price retailer in North America, operating 2,273+ locations across the United States:
- Industry: Off-Price Retail (Value Apparel & Home Goods)
- Market Cap: $58.81 billion
- Store Brands: Ross Dress for Less (2,100+ stores), dd's DISCOUNTS (170+ stores)
- Business Model: "Treasure hunt" shopping experience with 40-70% discounts on brand-name merchandise
- Geographic Footprint: 44 states, DC, Guam, and Puerto Rico (newly entered market)
- Key Differentiator: Domestic-only focus (vs TJX's global complexity), targets value-seeking middle-income consumers
- Stock Status: Trading at all-time highs of $182.58 after surging from ~$155 in September (+17.8% in 3 months)
💰 The Option Flow Breakdown
📊 What Just Happened
The Tape (December 11, 2025):
| Time | Symbol | Side | Buy/Sell | Type | Expiration | Premium | Strike | Volume | Spot | Unusual Score |
|---|---|---|---|---|---|---|---|---|---|---|
| Session | ROST $200 CALL | MID | BUY | CALL | 2026-05-15 | $663K | $200 | 1,300 | $182.58 | Z-Score: 121.63 |
Option Symbol: ROST20260515C200
Total Premium: $663,000 (1,300 contracts)
🤓 What This Actually Means
This is a long call position - the purest expression of bullish conviction! The trader:
- ✅ Pays $663K in premium for the right to buy ROST at $200 by May 15, 2026
- ✅ Maximum risk: $663K (the premium paid)
- ✅ Breakeven: ~$205.10 ($200 strike + ~$5.10 premium per contract)
- ✅ Maximum profit: Unlimited as stock rises above breakeven
- ✅ Days to expiration: 155 days (~5 months)
- ✅ Strategy: Betting on 9.5% upside from current levels
Unusual Score: 🚨 EXTREMELY_UNUSUAL - A Z-Score of 121.63 means this trade is 121 standard deviations above normal ROST option activity. To put this in perspective: in a normal distribution, a Z-Score above 3.0 occurs less than 0.3% of the time. A Z-Score of 121.63 is essentially statistically impossible by chance alone. This is either a massive institutional position, a large hedge fund taking a view, or someone with material non-public information (insider trading would be illegal).
Why this trade makes sense: ROST just crushed Q3 earnings with 7% comp sales growth, raised full-year guidance to $6.38-$6.46 EPS, and is expanding into new high-growth markets like Puerto Rico and New York Metro. With 10+ analysts raising price targets to as high as $205 (Jefferies), the institutional buyer is positioning for continued momentum through the critical Q4 holiday quarter, Q1 2026 earnings, and the company's aggressive expansion plan. May 2026 expiration captures two more earnings reports (Q4 in March 2026, Q1 in May 2026) and the full holiday shopping season results.
📈 Technical Setup / Chart Analysis
YTD Performance Chart
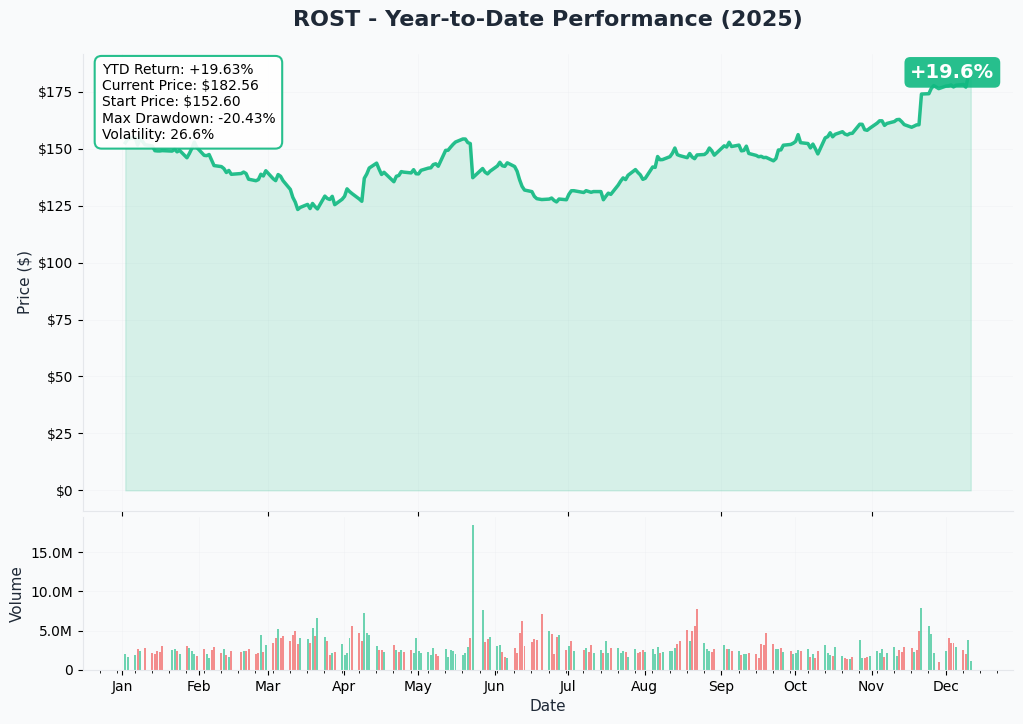
ROST is absolutely crushing it with a powerful year-to-date rally! After consolidating in the $155-165 range through Q3, the stock exploded post-earnings on November 20th, surging to all-time highs at $182.58. This represents a 17.8% gain from the September lows and puts ROST within striking distance of the $200 call strike.
Key observations:
- Breakout pattern: Clean breakout above $170 resistance with strong volume
- Momentum: Stock showing persistent buying pressure - classic "higher highs, higher lows" trend
- Support: Former resistance at $175-177 now acting as new support floor
- Resistance: Light resistance at $185, then clear sailing to psychological $200 level
- Institutional accumulation: 86.86% institutional ownership with net buying in Q2 2025
The technical setup is textbook bullish continuation - exactly what you want to see when deploying $663K in call premium.
Gamma-Based Support & Resistance Analysis
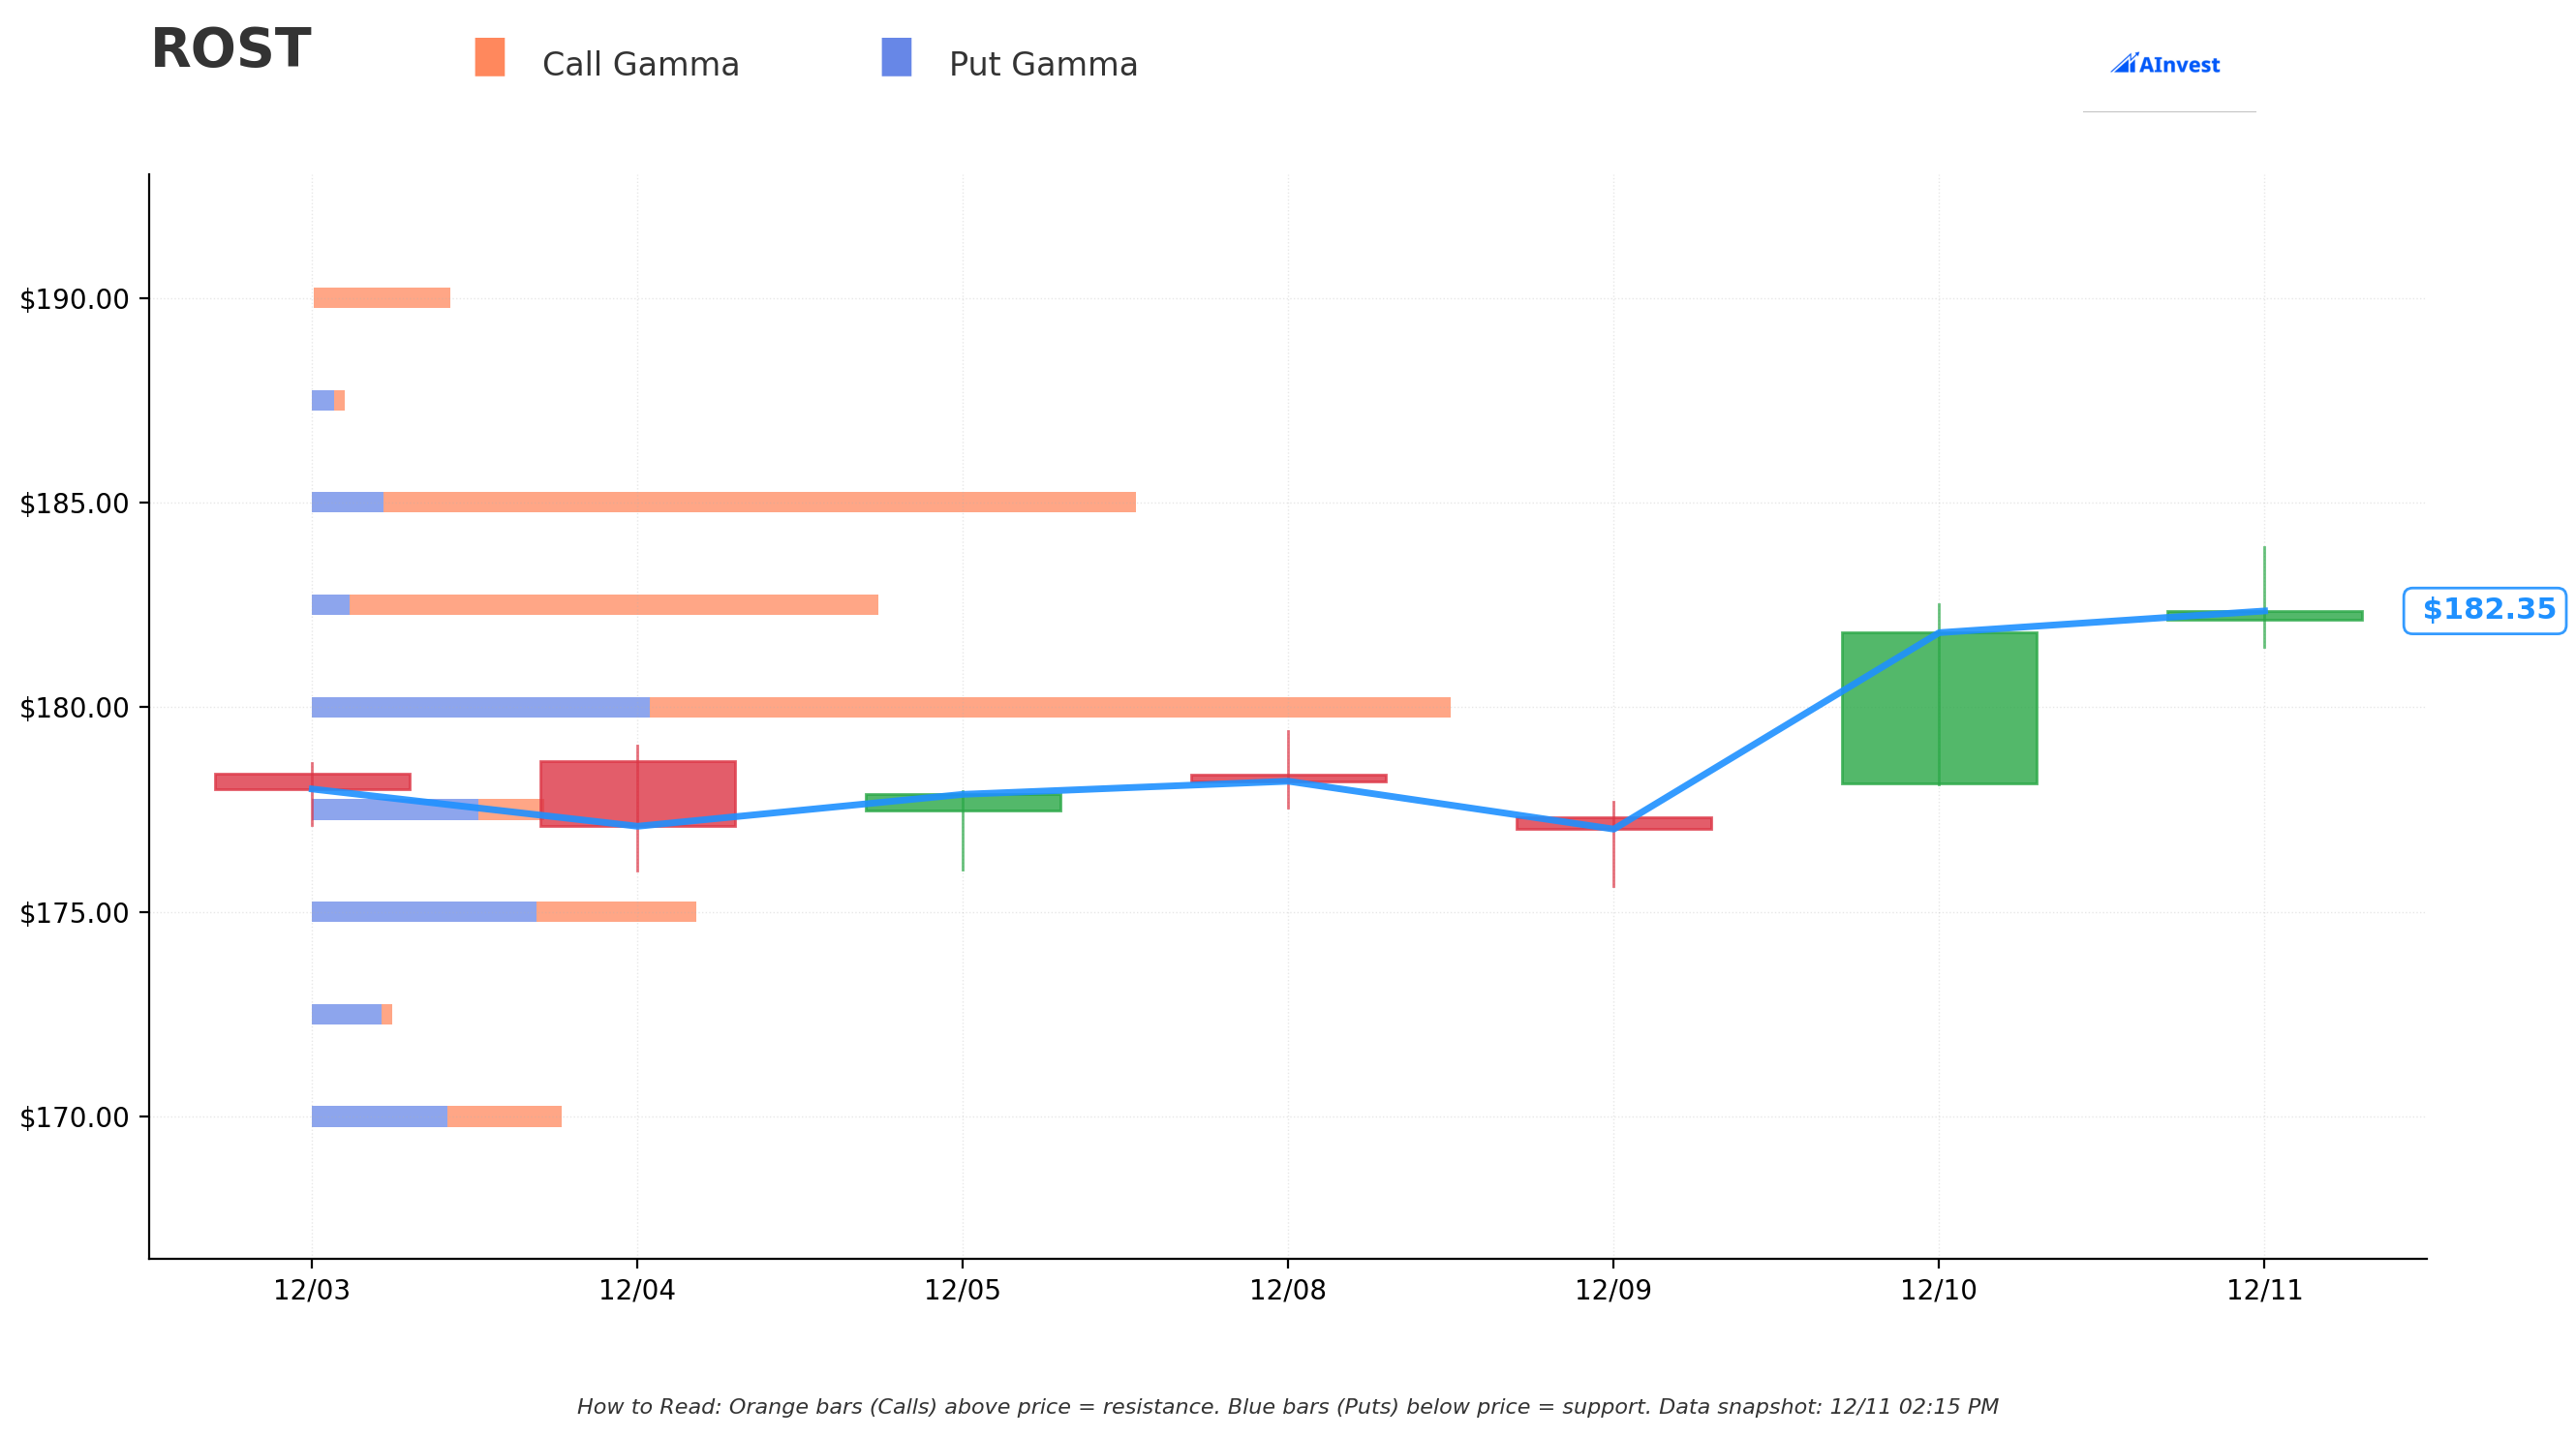
Current Price: $182.58
The gamma chart reveals critical levels that explain why $200 is the target:
🔵 Support Levels (Put Gamma - Net Bearish GEX):
- $182.50: Strongest immediate support at 1.95M GEX - this is our current floor
- $180.00: Major support zone at 3.90M GEX - first line of defense
- $177.50: Secondary support at 0.77M GEX
- $175.00: Strong floor at 1.25M GEX (former resistance, now support)
- $170.00: Deep support at 0.83M GEX
🟠 Resistance Levels (Call Gamma - Net Bullish GEX):
- $185.00: First resistance at 2.87M GEX - need to clear this first
- $190.00: Minor resistance at 0.47M GEX - should slice through easily
- $195.00: Light resistance at 0.34M GEX - final hurdle before $200
Net GEX Bias: Strongly Bullish - Call GEX of 9.77M vs Put GEX of 4.47M (2.2:1 ratio favoring calls)
What this means: The gamma profile shows dealers are positioned for upside, with massive call open interest creating positive convexity above $185. Once ROST breaks through the $185 level, market makers will need to buy stock to hedge their short call positions, creating a self-reinforcing rally toward $200. The support structure is incredibly strong with stacked put walls at $180-182.50, giving the stock a firm foundation to launch higher.
Implied Move Analysis
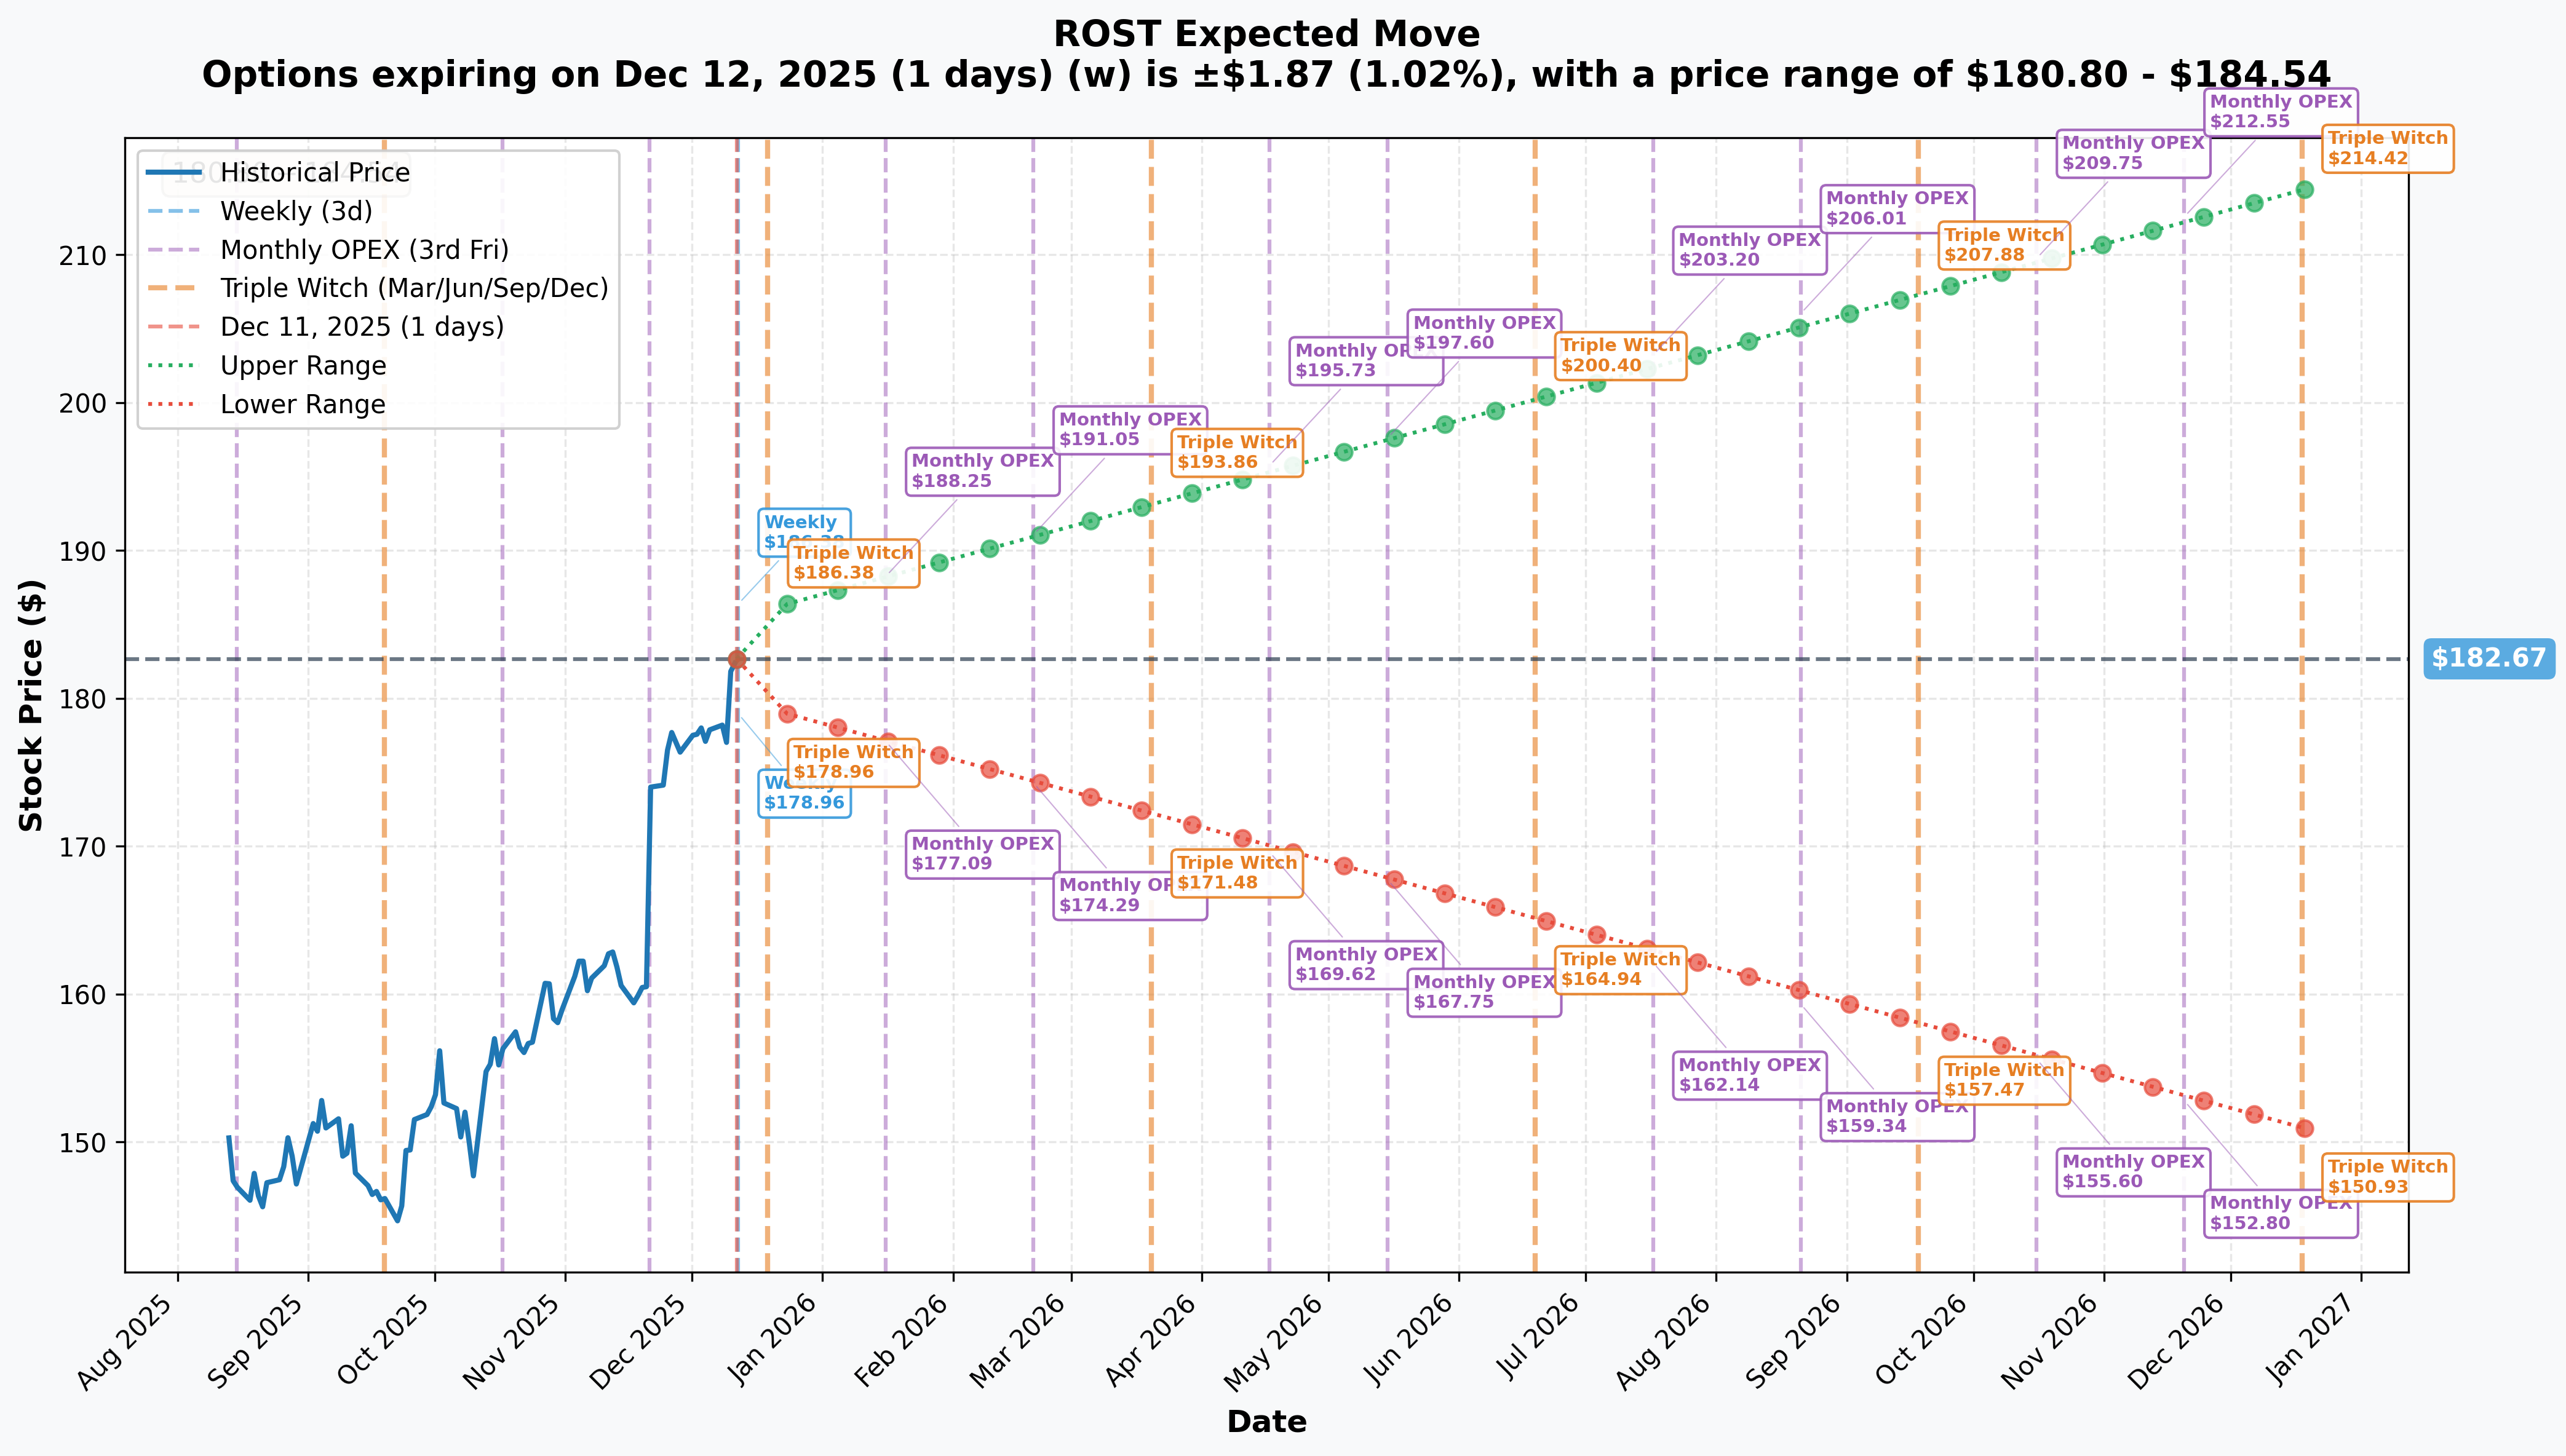
Options Market Pricing:
- Weekly (Dec 12): 1.02% move ($180.80-$184.54) - extremely tight range
- Monthly OPEX (Dec 19): 1.86% move ($179.27-$186.07) - still very low volatility
- LEAPS (Dec 2026): 17.38% move ($150.93-$214.42) - upper bound is $214!
Why this matters for the call buyer: The implied volatility is remarkably low at just 1.86% for the monthly cycle. This means options are cheap relative to recent historical moves. ROST just moved 17.8% in 3 months (September to December), yet the options market is pricing in only 17.38% for an entire year. The call buyer is essentially saying: "I think ROST can move 9.5% to $200 in 5 months, but the market is pricing in negligible volatility." This is a volatility arbitrage play - betting that actual realized volatility will exceed implied volatility.
The fact that the Dec 2026 LEAPS upper bound is $214 validates the $200 call strike as conservative. If ROST hits the options market's 1-year high-end estimate, these May $200 calls would be worth $14+ each at expiration ($214 stock - $200 strike = $14 intrinsic value).
🎪 Catalysts
Upcoming Events
Q4 Fiscal 2025 Earnings - Early March 2026
- Expected Release: First week of March 2026 (Q4 FY2024 was released March 4, 2025)
- EPS Guidance: $1.77 to $1.85 (midpoint $1.81)
- Comp Sales Guidance: 3% to 4% growth expected
- Revenue Forecast: $5.39 billion consensus
- Key Metrics to Watch:
- Holiday season performance (critical Q4 revenue driver)
- Operating margin expansion despite tariff headwinds
- New store productivity in Puerto Rico and New York markets
- Inventory management and packaway merchandise timing
- Market share gains vs TJX and Burlington
Why this matters: ROST historically moves 5-10% on earnings beats. If the company delivers another upside surprise like Q3 (12% EPS beat), we could see the stock gap toward $195-200 overnight.
Holiday Shopping Season - December 2025 - January 2026
- Consumer Behavior: 82% of consumers plan to shop promotions during holiday season, up from 79% in 2024
- Off-Price Traffic: Placer.ai reported steady increase in visits to off-price retailers between July-October 2025
- Competitive Position: 27% of Super Saturday 2024 shoppers purchased from discount stores
- Value Proposition: Critical inflection point as inflation-weary consumers trade down to off-price
Why this matters: If ROST delivers strong holiday comp sales (in line with 3-4% guidance or better), it sets up a massive Q4 earnings beat that could propel the stock to $200+ by March earnings.
Q1 Fiscal 2026 Earnings - Late May 2026
- Expected Release: Mid-to-late May 2026 (right before call expiration!)
- Spring Season: Key quarter for apparel and home goods refresh
- Store Expansion: New stores in Puerto Rico and NY Metro should be ramping productivity
- Tariff Update: Management commentary on "China-plus-one" strategy success
Why this matters: The May 15, 2026 call expiration is perfectly timed to capture pre-earnings IV expansion. Typically, options gain 20-30% in implied volatility in the week before earnings. If ROST is trading at $195-200 heading into late May earnings, these calls could be worth 2-3x even before the actual earnings release.
Recently Completed
Q3 2025 Earnings Blowout - November 20, 2025
- Revenue: $5.6 billion vs $5.46B consensus (2.6% beat)
- EPS: $1.58 vs $1.41 consensus (12% beat, $0.20 above estimates)
- Comp Sales: Up 7% vs 1% in prior year quarter
- Operating Margin: 11.6%, significantly stronger than expected despite 35 bps tariff impact
- Guidance Raise: Full-year EPS lifted to $6.38-$6.46 from $6.08-$6.21
Stock reaction: Surged from ~$170 to $182+ (+7% post-earnings move)
Analyst Upgrade Wave - November/December 2025
- Jefferies: Raised PT to $205 from $190, "Buy" rating (December 1)
- TD Cowen: Raised PT to $203 from $192 (December 4)
- Guggenheim: Initiated "Strong Buy" coverage (December 10)
- JPMorgan: Lifted PT to $200 from $188, "Overweight" (November 21)
- Bank of America: Boosted PT to $200 from $175, "Buy" (November 21)
Consensus: 16 analysts covering, majority "Buy" ratings, average price target range $176-$183, high-end $205
Store Expansion Milestone - November 2025
- 90 new stores opened in fiscal 2025: 80 Ross Dress for Less, 10 dd's DISCOUNTS
- Puerto Rico entry: Inaugural opening of 3 Ross stores
- New York Metro expansion: Expansion into NY, NJ, and Michigan markets
- Current footprint: 2,273 total locations (up from 2,192 in Q3 2024)
- Long-term target: At least 2,900 Ross and 700 dd's DISCOUNTS stores
Tariff Mitigation Success
- Q3 impact reduced: $0.05 per share (down from $0.11 in Q2)
- Q4 outlook: Tariff costs expected to be negligible
- Supply chain diversification: Accelerating shift to Vietnam, India, Malaysia
🎲 Price Targets & Probabilities
Using gamma levels, analyst targets, implied move data, and fundamental catalysts:
🚀 Bull Case (50% chance)
Target: $200-205
What needs to happen:
- Q4 holiday comp sales come in at 4%+ (high end of guidance or beat)
- Operating margins expand despite tariff headwinds
- Q4 earnings (March 2026) deliver another 10%+ EPS beat
- Off-price retail continues gaining share as 82% of consumers shop promotions
- New store productivity in Puerto Rico and NY Metro beats expectations
- Stock follows analyst price targets (Jefferies $205, TD Cowen $203)
For this trade:
- At $200: Intrinsic value of ~$0, but potential sale before expiration as stock approaches
- At $205: Intrinsic value of $5 = $650K value (breakeven on position)
- At $210: Intrinsic value of $10 = $1.3M value (2x return)
Key gamma catalyst: Once ROST breaks $185 resistance (2.87M GEX), dealers forced to buy stock creates momentum toward $200
Why 50% probability: ROST is executing flawlessly, already hit all-time highs, has analyst support at $200-205, and only needs a 9.5% move over 5 months. The company has delivered for 3 consecutive quarters and the macro backdrop (value-seeking consumers) is favorable.
😐 Base Case (35% chance)
Target: $185-195 range
What needs to happen:
- Q4 results meet expectations but don't blow them away (comp sales 3-4%)
- Stock consolidates current gains, moves sideways to slightly higher
- Market digests the 17.8% rally from September lows
- Consumer sentiment stays weak but doesn't deteriorate further (57% expect economic weakness)
- Competition from TJX and Burlington intensifies slightly
For this trade:
- At $185-190: Calls remain out-of-the-money, gradual theta decay
- At $195: Calls near breakeven, could exit for small loss or small gain depending on IV
- Time decay becomes a factor - need move above $195 to offset premium paid
Why 35% probability: ROST has strong momentum but is at all-time highs. Some consolidation or profit-taking is normal. The stock could easily trade in a $185-195 range if macro conditions stay stable but don't improve dramatically.
😰 Bear Case (15% chance)
Target: $165-180
What needs to happen:
- Q4 holiday sales disappoint (comp sales below 3%)
- Consumer spending weakens materially as 57% expect economy to worsen
- Tariff impacts return or worsen despite mitigation efforts
- Competition from TJX's scale advantage (5,085 stores vs ROST's 2,273) pressures market share
- Broader retail sector selloff
- Q4 earnings miss or guide lower for 2026
For this trade: Maximum loss of $663K - calls expire worthless
Key gamma support: Strong put walls at $180 (3.90M GEX) and $182.50 (1.95M GEX) should limit downside
Why only 15% probability: ROST has demonstrated consistent execution, the off-price retail sector is structurally growing at 7.9% CAGR, and the company just raised guidance despite headwinds. A move back below $180 would require a significant fundamental deterioration that isn't currently visible in the data.
💡 Trading Ideas
🛡️ Conservative: Mini Bull Call Spread (March Expiration)
Play: Buy the March 2026 $185 calls, sell the $195 calls
Target Entry: After Q4 earnings (March 2026) if stock pulls back to $180-185 range
Cost: ~$3.00 net debit per spread (estimate) Risk: $300 per spread maximum loss Reward: $1,000 maximum profit at $195 or above (233% return) Probability: 55% chance of profit if entered on dip
Why this works: Captures the post-Q4 earnings momentum toward analyst price targets with defined risk. The March expiration gives you the Q4 earnings catalyst while reducing premium decay. You're betting on a move from $185 to $195 (5.4% gain) rather than all the way to $200.
When to exit: Take profits at $190-192 for 60-80% of max gain, or hold through expiration if stock is trending toward $195.
⚖️ Balanced: Long May 2026 $190 Calls (Follow the Flow)
Play: Buy the May 2026 $190 calls outright
Target Entry: Current levels or on any dip to $180-182
Cost: ~$7-8 per contract (estimate, $700-800 per contract) Risk: Premium paid Reward: Scales with upside - unlimited profit potential above $197-198 breakeven Probability: 45% chance of profit
Why this works: Same expiration as the institutional flow but with a $190 strike that's more achievable ($7.42 move vs $17.42). You get exposure to both Q4 and Q1 earnings with less premium at risk. If ROST hits $200, these are worth $10 intrinsic value ($1,000 per contract) for a 25-40% return.
When to exit: Consider selling half at 50% profit, let the rest ride for earnings volatility plays.
🚀 Aggressive: Replicate the Whale (May 2026 $200 Calls)
Play: Buy the exact same position - May 2026 $200 calls
Target Entry: Only if you have high conviction and can stomach 100% loss
Cost: ~$5.10 per contract ($510 per contract based on $663K / 1,300 contracts) Risk: Total premium - these expire worthless if stock stays below $200 Reward: Unlimited above $205.10 breakeven - potential 2-5x return if bull case plays out Probability: 35% chance of profit
Why this works: You're shadowing a trade flagged as 121 standard deviations above normal. Someone with $663K to deploy clearly has conviction. If ROST hits Jefferies' $205 price target, you're breakeven. If it hits the Dec 2026 LEAPS upper bound of $214, these are worth $14 each (2.7x return).
When to exit: This is a binary bet. Either ROST gets to $200+ and you win big, or it doesn't and you lose most/all premium. Consider taking profits at 100%+ returns rather than holding to expiration.
Risk management: Only allocate 1-2% of portfolio to this trade. The Z-Score of 121.63 is unprecedented - it could be smart money, or it could be a hedge/complex strategy we don't see the full picture of.
⚠️ Risk Factors
What Could Go Wrong for This Bullish Trade
📉 Consumer Spending Collapse
- 57% of consumers expect economy to weaken in next six months (most negative since 1997)
- Average Black Friday spending down 4% year-over-year
- If consumer sentiment translates to actual spending cuts, comp sales could miss 3-4% targets
- ROST depends on discretionary spending - apparel purchases get delayed in recessions
🏪 Competition Intensifies
- TJX has massive scale advantage with 5,085 stores vs ROST's 2,273
- Burlington planning aggressive 101 net-new stores by early 2025
- TJX Q4 comp sales +5% vs ROST's Q3 +7% - competition is strong
- Promotional intensity could compress margins
💰 Tariff Risks Resurface
- Over 50% of merchandise originates from China
- Full-year FY2025 tariff impact of $0.22-$0.25 per share despite mitigation
- Policy uncertainty - new tariffs could be imposed
- "China-plus-one" diversification takes time to fully implement
📊 Execution Risks
- 39% of inventory in packaway merchandise requires precise timing
- New market expansion (Puerto Rico, NY Metro) could underperform
- Distribution costs rose 60 basis points in Q3
- SKU complexity and inventory management challenges
⏰ Premium Decay (Theta)
- $663K in premium decays every day
- Stock needs to move toward $200 relatively soon to offset time decay
- If ROST trades sideways at $180-185 for 3-4 months, calls lose significant value
🎢 Valuation Concerns
- Stock at all-time highs - limited margin of safety
- Average analyst price target of $183 only 0.2% above current price
- If Q4 results merely meet (not beat) expectations, profit-taking could push stock lower
- Market could rotate out of retail heading into 2026
📉 Macro Headwinds
- Rising unemployment could pressure discretionary spending
- 77% of shoppers expect higher holiday prices - demand destruction risk
- Broader market correction would drag ROST down regardless of fundamentals
🎯 The Bottom Line
Real talk: This $663K May 2026 $200 call position is one of the most statistically unusual trades we've ever seen (Z-Score of 121.63 is literally off the charts). Someone with serious capital is making a massive directional bet that ROST rallies 9.5% to $200 by mid-May 2026.
The fundamental case is compelling:
- Q3 comp sales accelerated to 7% vs 1% prior year - massive acceleration
- EPS beat by 12% ($1.58 vs $1.41) with guidance raised to $6.38-$6.46
- 90 new stores opened in FY2025, entering high-growth markets (Puerto Rico, NY Metro)
- Off-price retail growing at 7.9% CAGR to $678.9B by 2034
- 82% of consumers shopping promotions (up from 79%) - structural tailwind
- Tariff headwinds declining from $0.11/share in Q2 to $0.05 in Q3 to negligible in Q4
- 10+ analysts upgraded with price targets at $200-205 (Jefferies $205, JPM $200, BofA $200)
The technical case aligns: Gamma profile shows net bullish positioning (9.77M call GEX vs 4.47M put GEX), strong support structure at $180-182.50, and light resistance above $185. Stock breaking out to all-time highs with clean uptrend intact.
The volatility opportunity: Implied volatility at just 1.86% monthly makes options cheap. ROST moved 17.8% in 3 months but the market is pricing in <18% annualized vol. If realized volatility exceeds implied, these calls win even without massive directional move.
If you own ROST shares: This trade validates your thesis. Consider holding through Q4 earnings (March 2026) and potentially adding on any dip below $180.
If you're watching from sidelines: The next catalyst is the holiday shopping season data (December-January) followed by Q4 earnings in early March. If comp sales come in at 4%+ and management guides confidently for 2026, we could see a gap toward $195-200.
If you're bearish on retail: Wait for clear evidence that consumer spending is cracking. A Q4 earnings miss or weak guidance would be the signal. But fighting this trend while ROST is executing this well is dangerous.
The wild card: Why is the Z-Score 121.63? This level of statistical abnormality suggests either:
- Smart institutional money positioning ahead of a major catalyst we don't know about
- Hedge fund taking a large directional view based on proprietary consumer data
- Complex strategy where this is only one leg (though BTO suggests pure directional bet)
- Insider activity (illegal, but happens - watch for SEC filings)
Whatever the reason, when someone deploys $663K in premium with 155 days to expiration, they have strong conviction. The question is: do you?
Final verdict: This is a high-conviction bullish trade on a company that's firing on all cylinders in a sector that's structurally winning market share from traditional retail. The $200 target is ambitious but achievable given analyst support and execution momentum. The risk is that you're buying at all-time highs with limited room for error. For aggressive traders, shadowing this flow in smaller size makes sense. For conservative traders, wait for a dip to $180-182 support or use bull call spreads to reduce premium at risk.
Disclaimer: This analysis is for educational purposes only and does not constitute financial advice. Options trading involves substantial risk and may not be suitable for all investors. Always conduct your own research and consider consulting a financial advisor before making investment decisions.
Data sources: ThetaData (option flow), Market data (gamma/GEX levels), Company filings, Analyst reports. All links embedded inline for verification.