SEI Bear Put Spread - $4.4M Pre-Earnings Hedge Play
October 17, 2025 | Unusual Activity Detected
🎯 The Quick Take
Someone just dropped $4.4M on a bear put spread on Solaris Energy Infrastructure at 10:26:33 AM today! This massive institutional play is positioning for downside ahead of the November 3rd earnings, betting SEI pulls back from its parabolic +70% YTD run. Translation: Smart money thinks this AI data center darling needs a breather!
📊 Company Overview
Solaris Energy Infrastructure, Inc. (SEI) is a Houston-based energy infrastructure company that pivoted from oilfield services to AI data center power:
- Market Cap: $2.51 Billion
- Industry: Oil & Gas Field Machinery & Equipment
- Primary Business: Mobile natural gas turbine power solutions for data centers, with 96% of turbine revenue from xAI (Elon Musk's AI company)
- Current Operational Capacity: ~600 MW with target of 1,400 MW by Q2 2027
The company is riding the massive AI data center power boom, providing distributed power solutions to xAI's Colossus supercomputer facilities in Memphis with over 1,140 MW committed through 2027.
📊 The Option Flow Breakdown
The Tape (October 17, 2025 @ 10:26:33):
| Time | Symbol | Side | Buy/Sell | C/P | Expiration | Premium | Strike | Volume | OI | Size | Spot | Option Price |
|---|---|---|---|---|---|---|---|---|---|---|---|---|
| 10:26:33 | SEI | ASK | BUY | PUT | 2025-11-21 | $3.3M | $50 | 5K | 38 | 5,000 | $52.01 | $6.50 |
| 10:26:33 | SEI | MID | BUY | PUT | 2025-11-21 | $1.1M | $40 | 5K | 976 | 5,000 | $52.01 | $2.26 |
Option Symbols:
- Long Put: SEI20251121P50
- Short Put: SEI20251121P40
Net Debit: $6.50 - $2.26 = $4.24 per contract = $2.2M total paid (for the spread)
🤓 What This Actually Means
This is a bear put spread - a defined-risk way to bet on downside! The trader:
- Buys 5,000 contracts of $50 strike puts for $6.50 (paying $3.3M)
- Sells 5,000 contracts of $40 strike puts for $2.26 (collecting $1.1M)
- Profits if SEI drops below $45.76 breakeven by November 21st
- Maximum profit of $2.88M if SEI closes below $40
- Maximum loss of $2.2M (premium paid) if SEI stays above $50
Breakeven: $50 - $4.24 = $45.76 (needs 12% drop from current $52.01)
Unusual Signals:
- The $50 strike had only 38 open interest vs 5,000 volume - this is 131x the existing OI!
- Executed at the ASK on the long leg = aggressive buyer paying up for protection
- Positioned perfectly to capture earnings volatility (Nov 3rd) with 18 days after the event
- Large size shows institutional hedging or conviction play
📈 Technical Setup / Chart Analysis
YTD Performance Chart
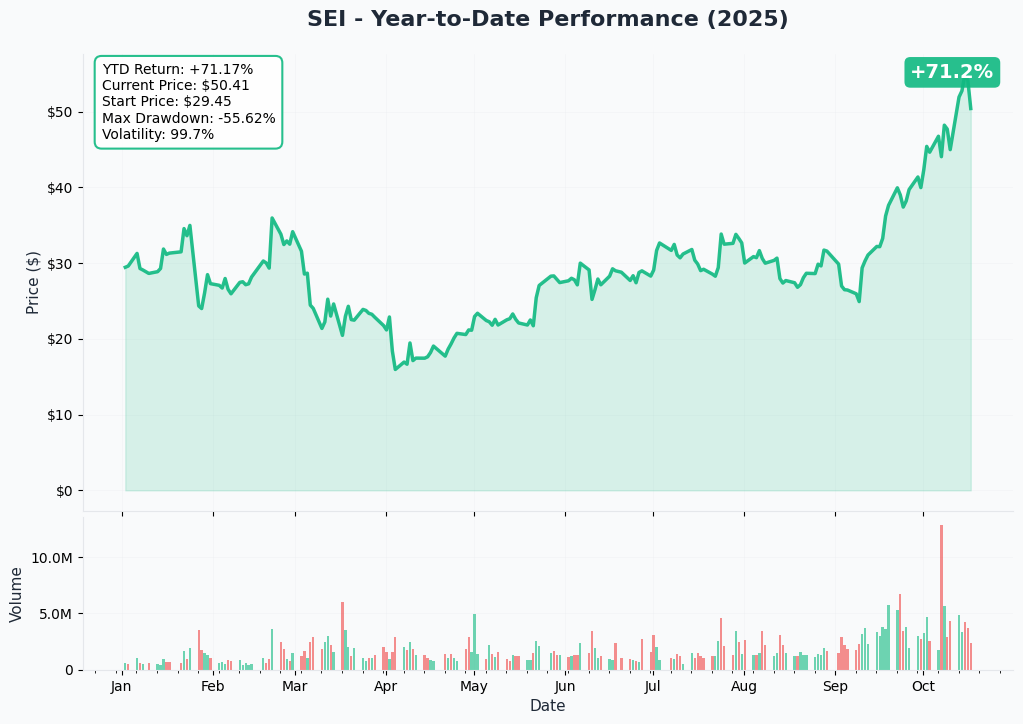
Solaris Energy Infrastructure is having an explosive 2025 with +70.3% YTD performance - but this parabolic move is exactly why this spread makes sense. The stock climbed from $29.45 to $50.14, surviving a brutal -55.6% max drawdown earlier in the year.
Key observations:
- Extreme volatility: 99.8% implied volatility signals massive moves expected
- Parabolic rally: Nearly vertical move from September lows around $25 to current $50+
- Recent breakout: October volume surge coincides with $729M capital raise announcement
- Overextension concerns: Trading near YTD highs with earnings approaching
This chart screams "profit-taking opportunity" - exactly what this bear put spread captures!
Gamma-Based Support & Resistance Analysis
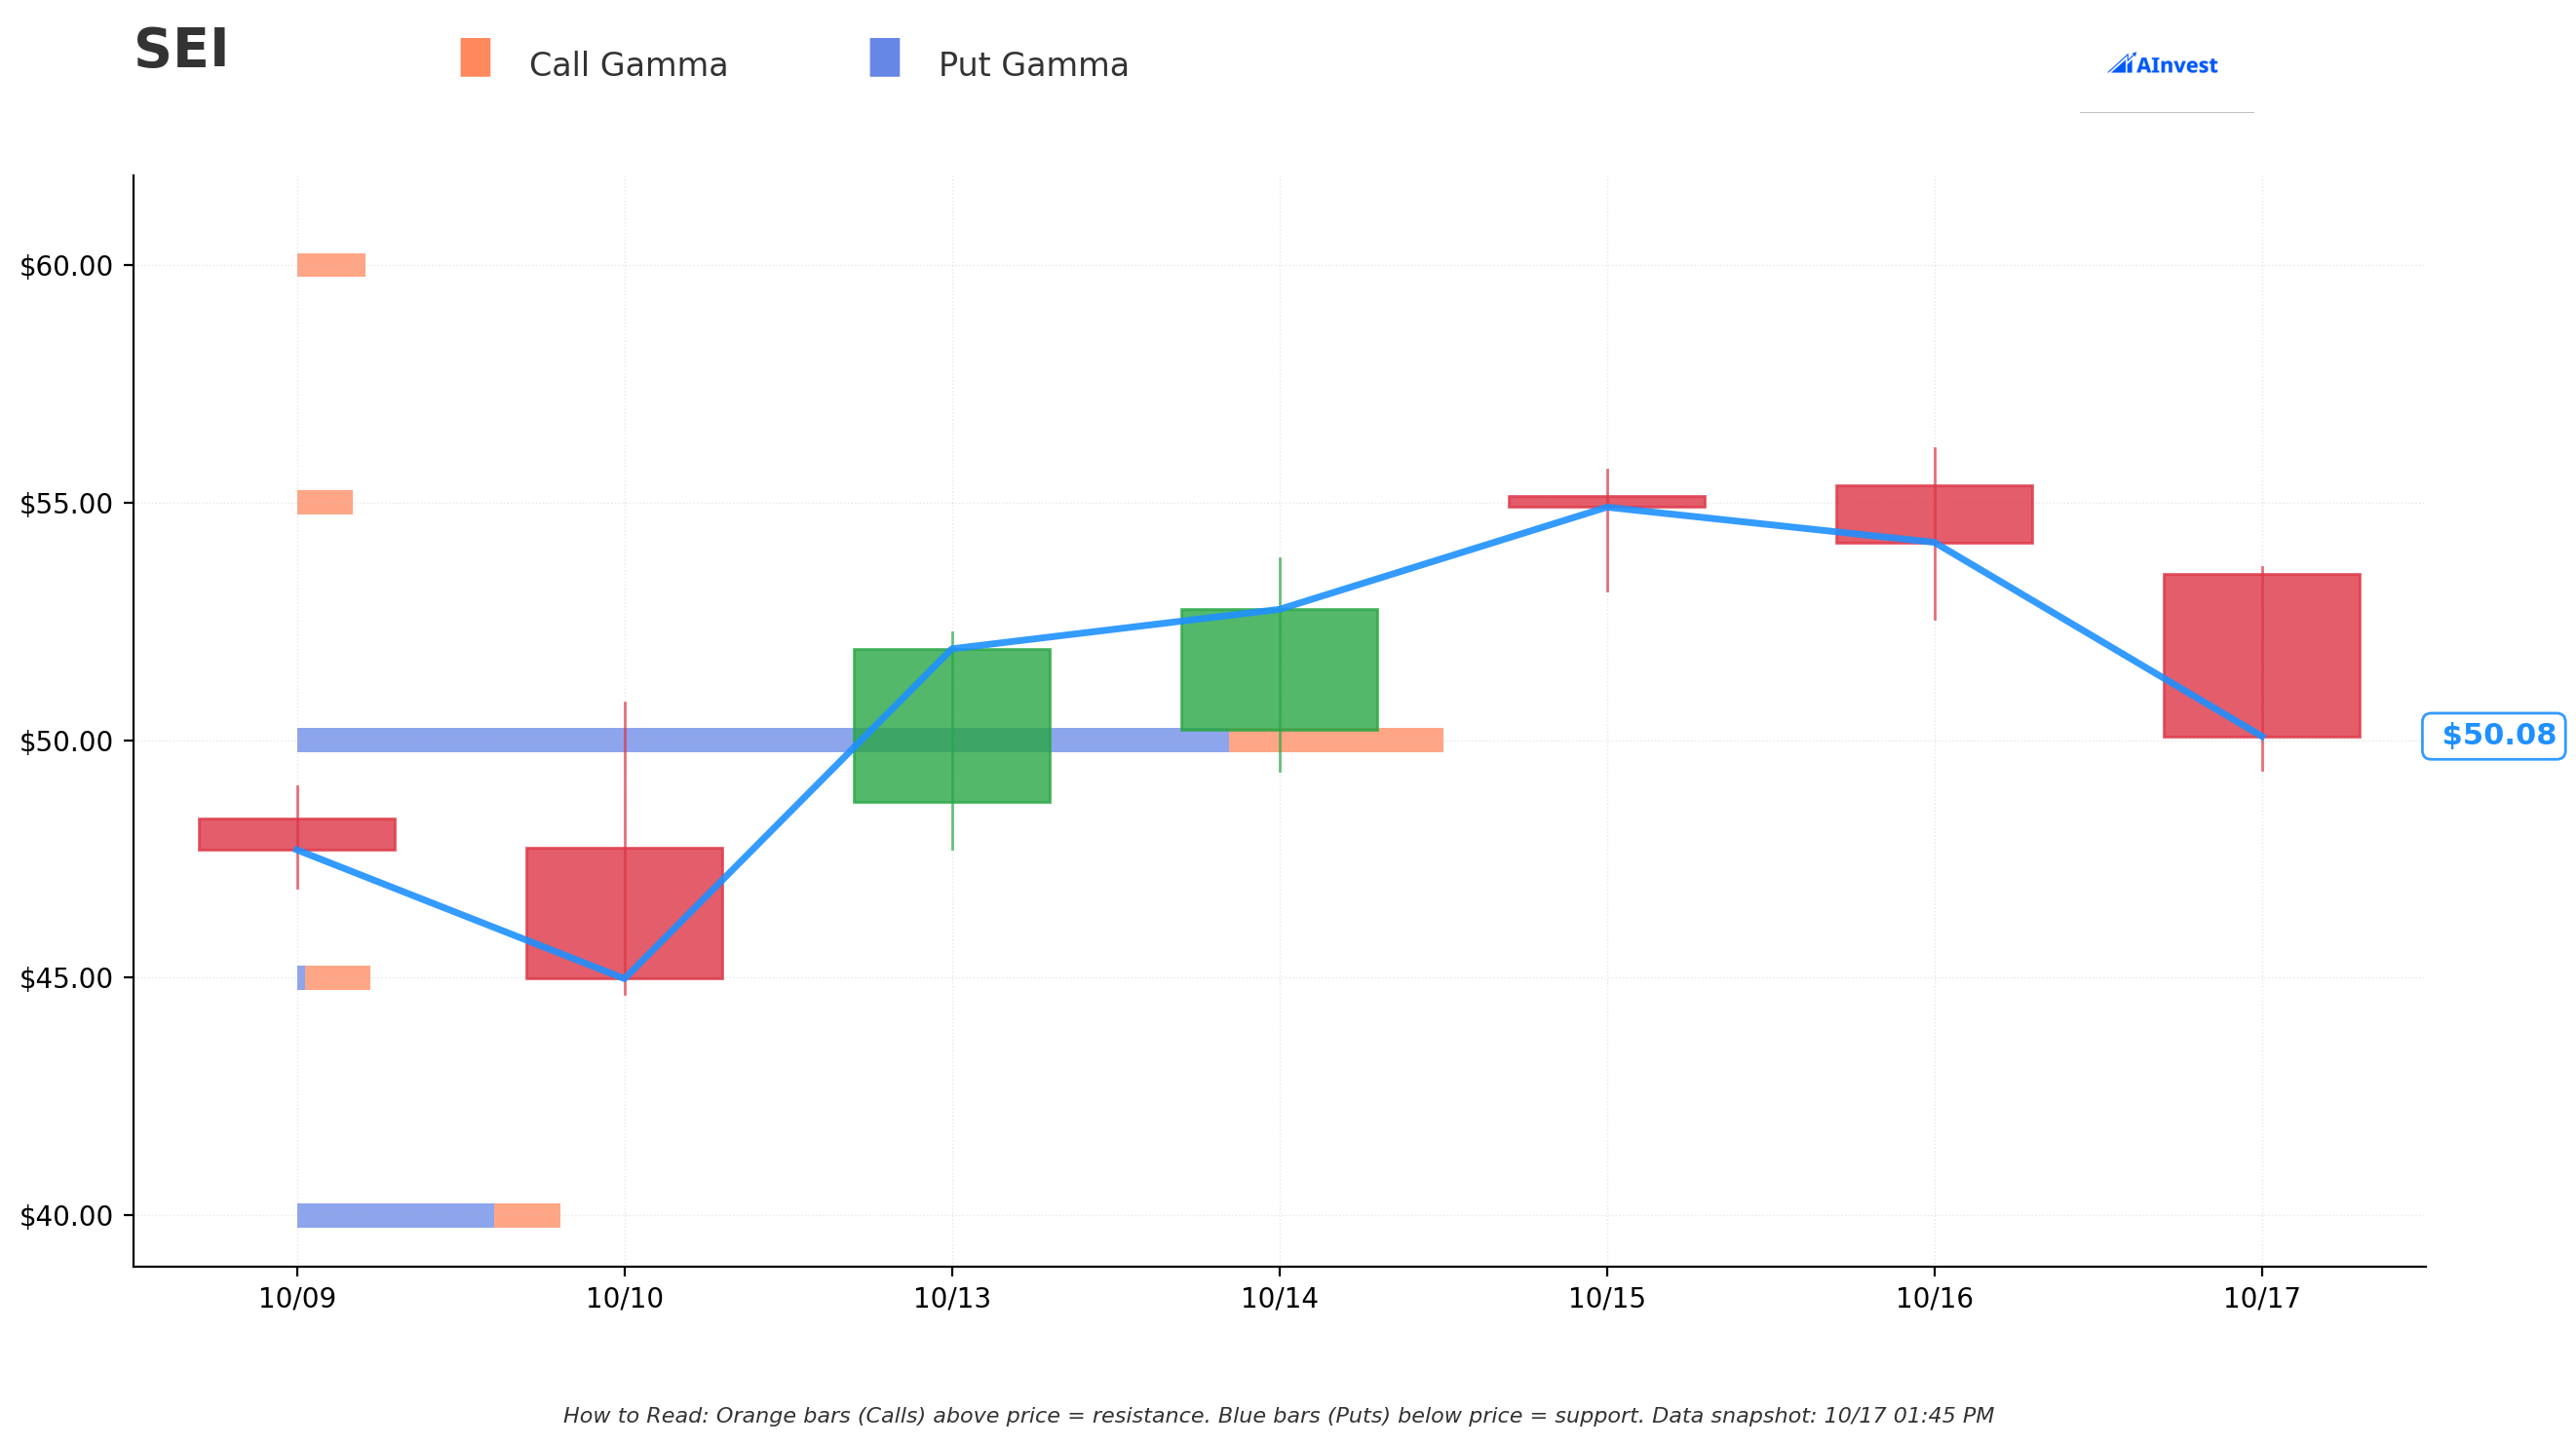
Current Price: $50.08 (per gamma chart timestamp 10/17 01:45 PM)
The gamma chart reveals critical levels that explain this trade's strike selection:
Immediate Resistance:
- $50 strike: Massive put gamma concentration (4.75 total GEX) creating strong resistance
- Price sitting right AT this level makes it perfect for the long put strike
- $55 strike: Minor resistance with 0.28 total GEX at 10.2% above current price
Support Levels Below:
- $45 strike: Strong support with 0.37 total GEX (9.8% below current)
- $40 strike: Massive support floor with 1.34 total GEX (19.8% below current)
GEX Analysis from gex.json:
- Total Put GEX: 6.69 (heavily put-skewed)
- Total Call GEX: 3.00
- Net GEX Bias: BEARISH (-3.66 net negative gamma)
- Strongest Support: $45 (0.29 net positive GEX)
- Strongest Resistance: $50 (5.84 total GEX wall)
This gamma setup PERFECTLY explains the trade - the $50 strike is where maximum put gamma sits, and $40 is the natural floor. The trader is betting on a pullback to the $45 support zone!
⚡ Catalysts
Upcoming Events
Q3 2025 Earnings - November 3-4, 2025 ⚠️
- Results released after market close November 3rd, conference call November 4th
- Wall Street watching for progress on 1,400 MW turbine fleet buildout
- Updated 2026 guidance expected
- Key focus: New contracts beyond xAI to reduce 96% customer concentration
- Raised Q3/Q4 guidance: $58-63M Adjusted EBITDA per quarter (up from $55-60M prior)
- Power Solutions expected to exceed 600 MW earning revenue
xAI "Colossus 2" Data Center Expansion - MAJOR GROWTH DRIVER
- xAI secured $10 billion in debt and equity financing in October 2025 to fund expansion
- Current Memphis site (Colossus 1): ~240 MW of turbines operational
- Joint Venture (50.1% Solaris, 49.9% xAI) deploying 900 MW additional capacity
- Total xAI commitment: Over 1,140 MW through 2027, with potential to expand to 1.5+ GW
- JV spent $112M in capex in Q2 2025 alone, with spending accelerating in Q4 2025/Q1 2026
- Regulatory Risk: NAACP lawsuit alleging Clean Air Act violations - satellite imagery showed 24-35 turbines operating vs 15 permitted, could delay expansion
Data Center Power Demand Surge - STRUCTURAL TAILWIND
- Data centers expected to add 65 GW of demand by 2029, accounting for 44% of U.S. electricity demand growth by 2028
- AI workloads will comprise 50-70% of data center power demand by 2030
- Grid interconnection delays and infrastructure bottlenecks driving demand for distributed, on-site power solutions like Solaris's mobile turbines
- Creates massive addressable market for Solaris beyond xAI
Capital Raise & Fleet Expansion - FUNDING SECURED
- October 2025: $729M in financing completed
- $650M convertible notes + $79.2M follow-on equity
- Funds will support acquisition of 80 MW additional turbine capacity for delivery through 2026
- Strengthens balance sheet and provides flexibility for large-scale growth initiatives
Diversification Beyond xAI - KEY DE-RISKING CATALYST
- While xAI represents 96% of turbine revenue currently, Solaris has ~425 MW available for contracting to new customers
- Securing additional contracts with other data center operators or industrial clients would be major de-risking catalyst
Recently Completed
Q2 2025 Strong Results (July 2025)
- Revenue: $149.3M (+18% sequentially)
- Net Income: $24M ($0.30 per diluted share)
- Adjusted EBITDA: $61M (+29% from Q1)
- Power Solutions generated ~35% of total revenue in first full quarter
Mobile Energy Rentals Acquisition (September 2024)
- $200M transformational acquisition completed
- Added ~600 MW operational turbine capacity
- Company rebranded from "Solaris Oilfield Infrastructure" to current name
- MER founders received approximately 27% ownership stake in combined entity
Analyst Upgrades & Price Targets
- Strong Buy consensus rating from 8 analysts (3 Strong Buy, 5 Buy)
- Stock surged +295.8% year-over-year and +72.3% over past month
- Recent upgrade to Zacks Rank #2 (Buy) in September 2025, reflecting improving earnings outlook
🎯 Price Targets & Probabilities
Using gamma levels, technical setup, and earnings timing:
🚀 Bull Case (20% chance)
Target: $55-60
- Earnings blowout with new customer wins announced
- xAI regulatory issues resolved favorably
- Diversification beyond single customer reduces risk premium
- Data center power demand acceleration
Risk to this trade: Full $2.2M loss if rally continues
😐 Base Case (50% chance)
Target: $45-50 range
- Mixed earnings with in-line results
- No major new contract announcements
- Profit-taking after 70% YTD run
- Stock consolidates at gamma support around $45
Profitable scenario: Spread makes $1M-2.88M depending on where it lands
😰 Bear Case (30% chance)
Target: $35-40
- Earnings disappointment or guidance cut
- xAI regulatory issues escalate
- Broader market correction hits speculative AI plays
- Customer concentration concerns intensify
Maximum profit: $2.88M if closes below $40
💡 Trading Ideas
🛡️ Conservative: Small Bearish Hedge
Play: Buy individual puts below $50 (Nov 21st expiration)
Buy $45 puts (1-5 contracts)
Risk: Premium paid (~$4-5 per contract) Reward: Captures earnings volatility with gamma support at $45
Why this works: Defined risk, positioned at strong support level
⚖️ Balanced: Follow the Smart Money
Play: Small bear put spread (Nov 21st expiration)
Risk: $5 spread width minus credit received Reward: Profits if pullback to $45 support zone
Why this works: Captures same thesis as institutional trade with smaller size
🚀 Aggressive: Counter-Trade the Hedge
Play: Sell cash-secured puts at $45 support
Sell $45 puts (Nov 21st)
Risk: Must buy stock at $45 if assigned Reward: Premium collected if stays above support
Why this works: If institutional trade is just hedging long stock, $45 is great entry point
⚠️ Risk Factors
- Customer Concentration: 96% of turbine revenue from single customer xAI - massive dependency risk
- Regulatory Headwinds: NAACP lawsuit over Memphis turbine permits could constrain operations
- Valuation Concerns: Trading at P/E of 86.67 after 70% YTD run - priced for perfection
- Equipment Quality: Industry criticism of using "very old turbines" that don't meet modern emissions standards
- Execution Risk: Scaling from 600 MW to 1,400 MW requires flawless execution
- AI Hype Cycle: If AI investment slows, data center power demand could disappoint
🏁 The Bottom Line
Real talk: This $4.4M bear put spread is a textbook pre-earnings hedge on a stock that's up 70% YTD and trading near parabolic resistance. The gamma data backs this up with massive $50 strike concentration.
If you own SEI: Consider trimming or hedging before November 3rd earnings - institutional money is clearly concerned about downside
If you're watching: The $45-50 zone is the battleground. Below $45.76 breakeven, this spread starts printing money
If you're bullish: Wait for post-earnings clarity or look for entry at the $45 gamma support if we get a pullback
Mark your calendar: November 3-4 earnings will be the catalyst that decides this trade's fate. With 96% customer concentration and regulatory uncertainties, any negative surprise could send this to the $40 floor fast!
Disclaimer: Options trading involves substantial risk. This analysis is for educational purposes only and not financial advice. Past performance doesn't guarantee future results. The unusual activity described could represent hedging, speculation, or complex strategies - we don't know the trader's full position or intent.
About Solaris Energy Infrastructure: Solaris Energy Infrastructure provides mobile natural gas turbine power solutions for data centers and commercial/industrial sectors with a $2.51 billion market cap in the oil & gas field machinery & equipment sector.