🐋 QQQ $11M Put Unwind - Smart Money Closing Their Hedge Into Chaos!
📅 March 23, 2026 | 🔥 Unusual Activity Detected
🎯 The Quick Take
Someone just closed $11 MILLION worth of QQQ put protection this morning - buying back 5,000 contracts of $585 strike puts expiring June 18th at $21.20 per share. This isn't someone placing a new bet; this is institutional money taking their hedge off the table in the middle of a market storm involving an Iran war, a hawkish Fed, and the largest QQQ outflow reversal ever recorded. Translation: smart money decided the downside protection they paid for is no longer needed - or they're locking in gains from a put position that has likely appreciated significantly during the recent tech selloff.
📊 ETF Overview
Invesco QQQ Trust (QQQ) is the second-largest ETF in the world and the definitive Nasdaq-100 tracker:
- AUM: ~$130 billion
- What it tracks: Nasdaq-100 Index (top 100 non-financial Nasdaq-listed companies)
- Current Price: $587.56 (down from 52-week high of $637.01)
- 52-Week Range: $402.39 - $637.01
- Top Holdings: NVDA (8.66%), AAPL (7.34%), MSFT (5.77%), AMZN (4.45%), TSLA (3.79%)
- Fund Type: Growth/Tech-heavy; top 10 holdings = 46.72% of the fund
- Recent Pain: $7 billion net outflow in February 2026 - the largest inflow-to-outflow reversal in QQQ's history
QQQ is essentially a bet on Magnificent 7 tech leadership and the AI buildout cycle. When AI sentiment is hot, QQQ rips. When macro fear hits, QQQ is the first thing institutions sell.
💰 The Option Flow Breakdown
The Tape - March 23, 2026 @ 10:21:15:
| Time | Ticker | Side | Buy/Sell | Type | Strike | Expiration | Premium | Option Price | Volume | OI | Size | Spot | Contract |
|---|---|---|---|---|---|---|---|---|---|---|---|---|---|
| 10:21:15 | QQQ | MID | BUY | PUT | $584.78 | 2026-06-18 | $11M | $21.20 | 5,000 | 15,000 | 5,000 | $594.06 | QQQ20260618P584 |
Order Classification: BTC (Buy to Close) | Strategy: STANDALONE | Z-Score: 6.46 (EXTREMELY UNUSUAL)
🤓 What This Actually Means
This is a Buy to Close - meaning someone who was previously short these puts is now closing that position. Let's break down what's actually going on:
- 🔄 BTC = closing a short put: The trader originally sold these $585 put contracts (collecting premium), and is now buying them back. That's the complete opposite of someone placing a new bearish bet.
- 💰 $11M to close out: At $21.20 per contract, they're paying $11M to exit. If they sold these puts weeks ago when QQQ was near its highs, they may have collected more premium than they're paying back - locking in profit on a short put strategy.
- 🛡️ Or they held a hedge: Alternatively, this could be a portfolio manager who owned these puts as downside protection and is now removing the hedge - perhaps believing the worst of the selloff is behind them, or needing to raise cash.
- 📊 Strike context: $584.78 puts are just 1.6% out of the money from the $594 spot price at time of trade. These are near-the-money puts with meaningful delta, not deep OTM lottery tickets.
- ⏰ 87 days to expiration: June 18th is a Triple Witch expiration - quarterly options expiry with maximum liquidity and institutional participation.
What's really happening here: The 15,000 existing open interest tells us this isn't an isolated trade - there's a significant put position at this strike. Buying 5,000 contracts (33% of OI in a single transaction) is a meaningful unwind. With QQQ down from its $637 highs amid the Iran war selloff and Fed holding rates, these puts have likely gained significant value. Someone is taking profits or removing protection.
Unusual Score: 🔥 EXTREMELY UNUSUAL (Z-Score: 6.46) - Volume represents 33% of existing open interest in a single order. Only 2 trades of similar magnitude in the past 30 days. This is a meaningful institutional repositioning, not a retail dabble.
📈 Technical Setup / Chart Check-Up
YTD Performance Chart
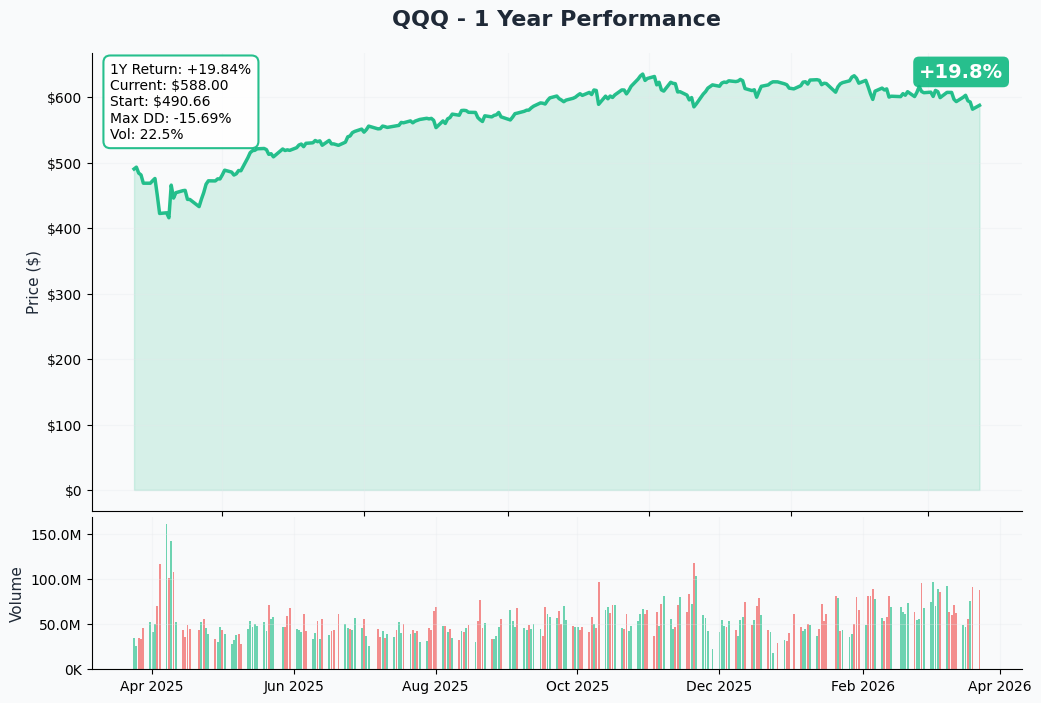
QQQ has had a brutal few months. From a 52-week high of $637.01, the ETF has pulled back to $587.56 - a -7.8% drawdown from peak. The damage accelerated in February-March 2026 as multiple macro shocks layered on top of each other: the Iran war erupting February 28th, DeepSeek V4 release February 23rd questioning AI spending efficiency, and the Fed holding rates at 3.50-3.75% on March 18th with only one cut projected for all of 2026.
Key observations:
- 📉 Peak-to-trough: $637 high to $578.54 intraday low on March 20th = -9.2% drawdown
- 🛢️ Oil shock driver: Brent crude hit $113.71/barrel on March 19th, creating stagflation fears
- 🔻 Momentum damaged: VIX at 26.78, spiked to 31.77 on March 9th - fear is elevated but not panic
- 📊 Volume note: $7B outflow in February was the largest single-month reversal in QQQ's history
- 👀 Key level watch: $587 is roughly where we're trading - right on top of the gamma battlefield
Gamma-Based Support & Resistance Analysis
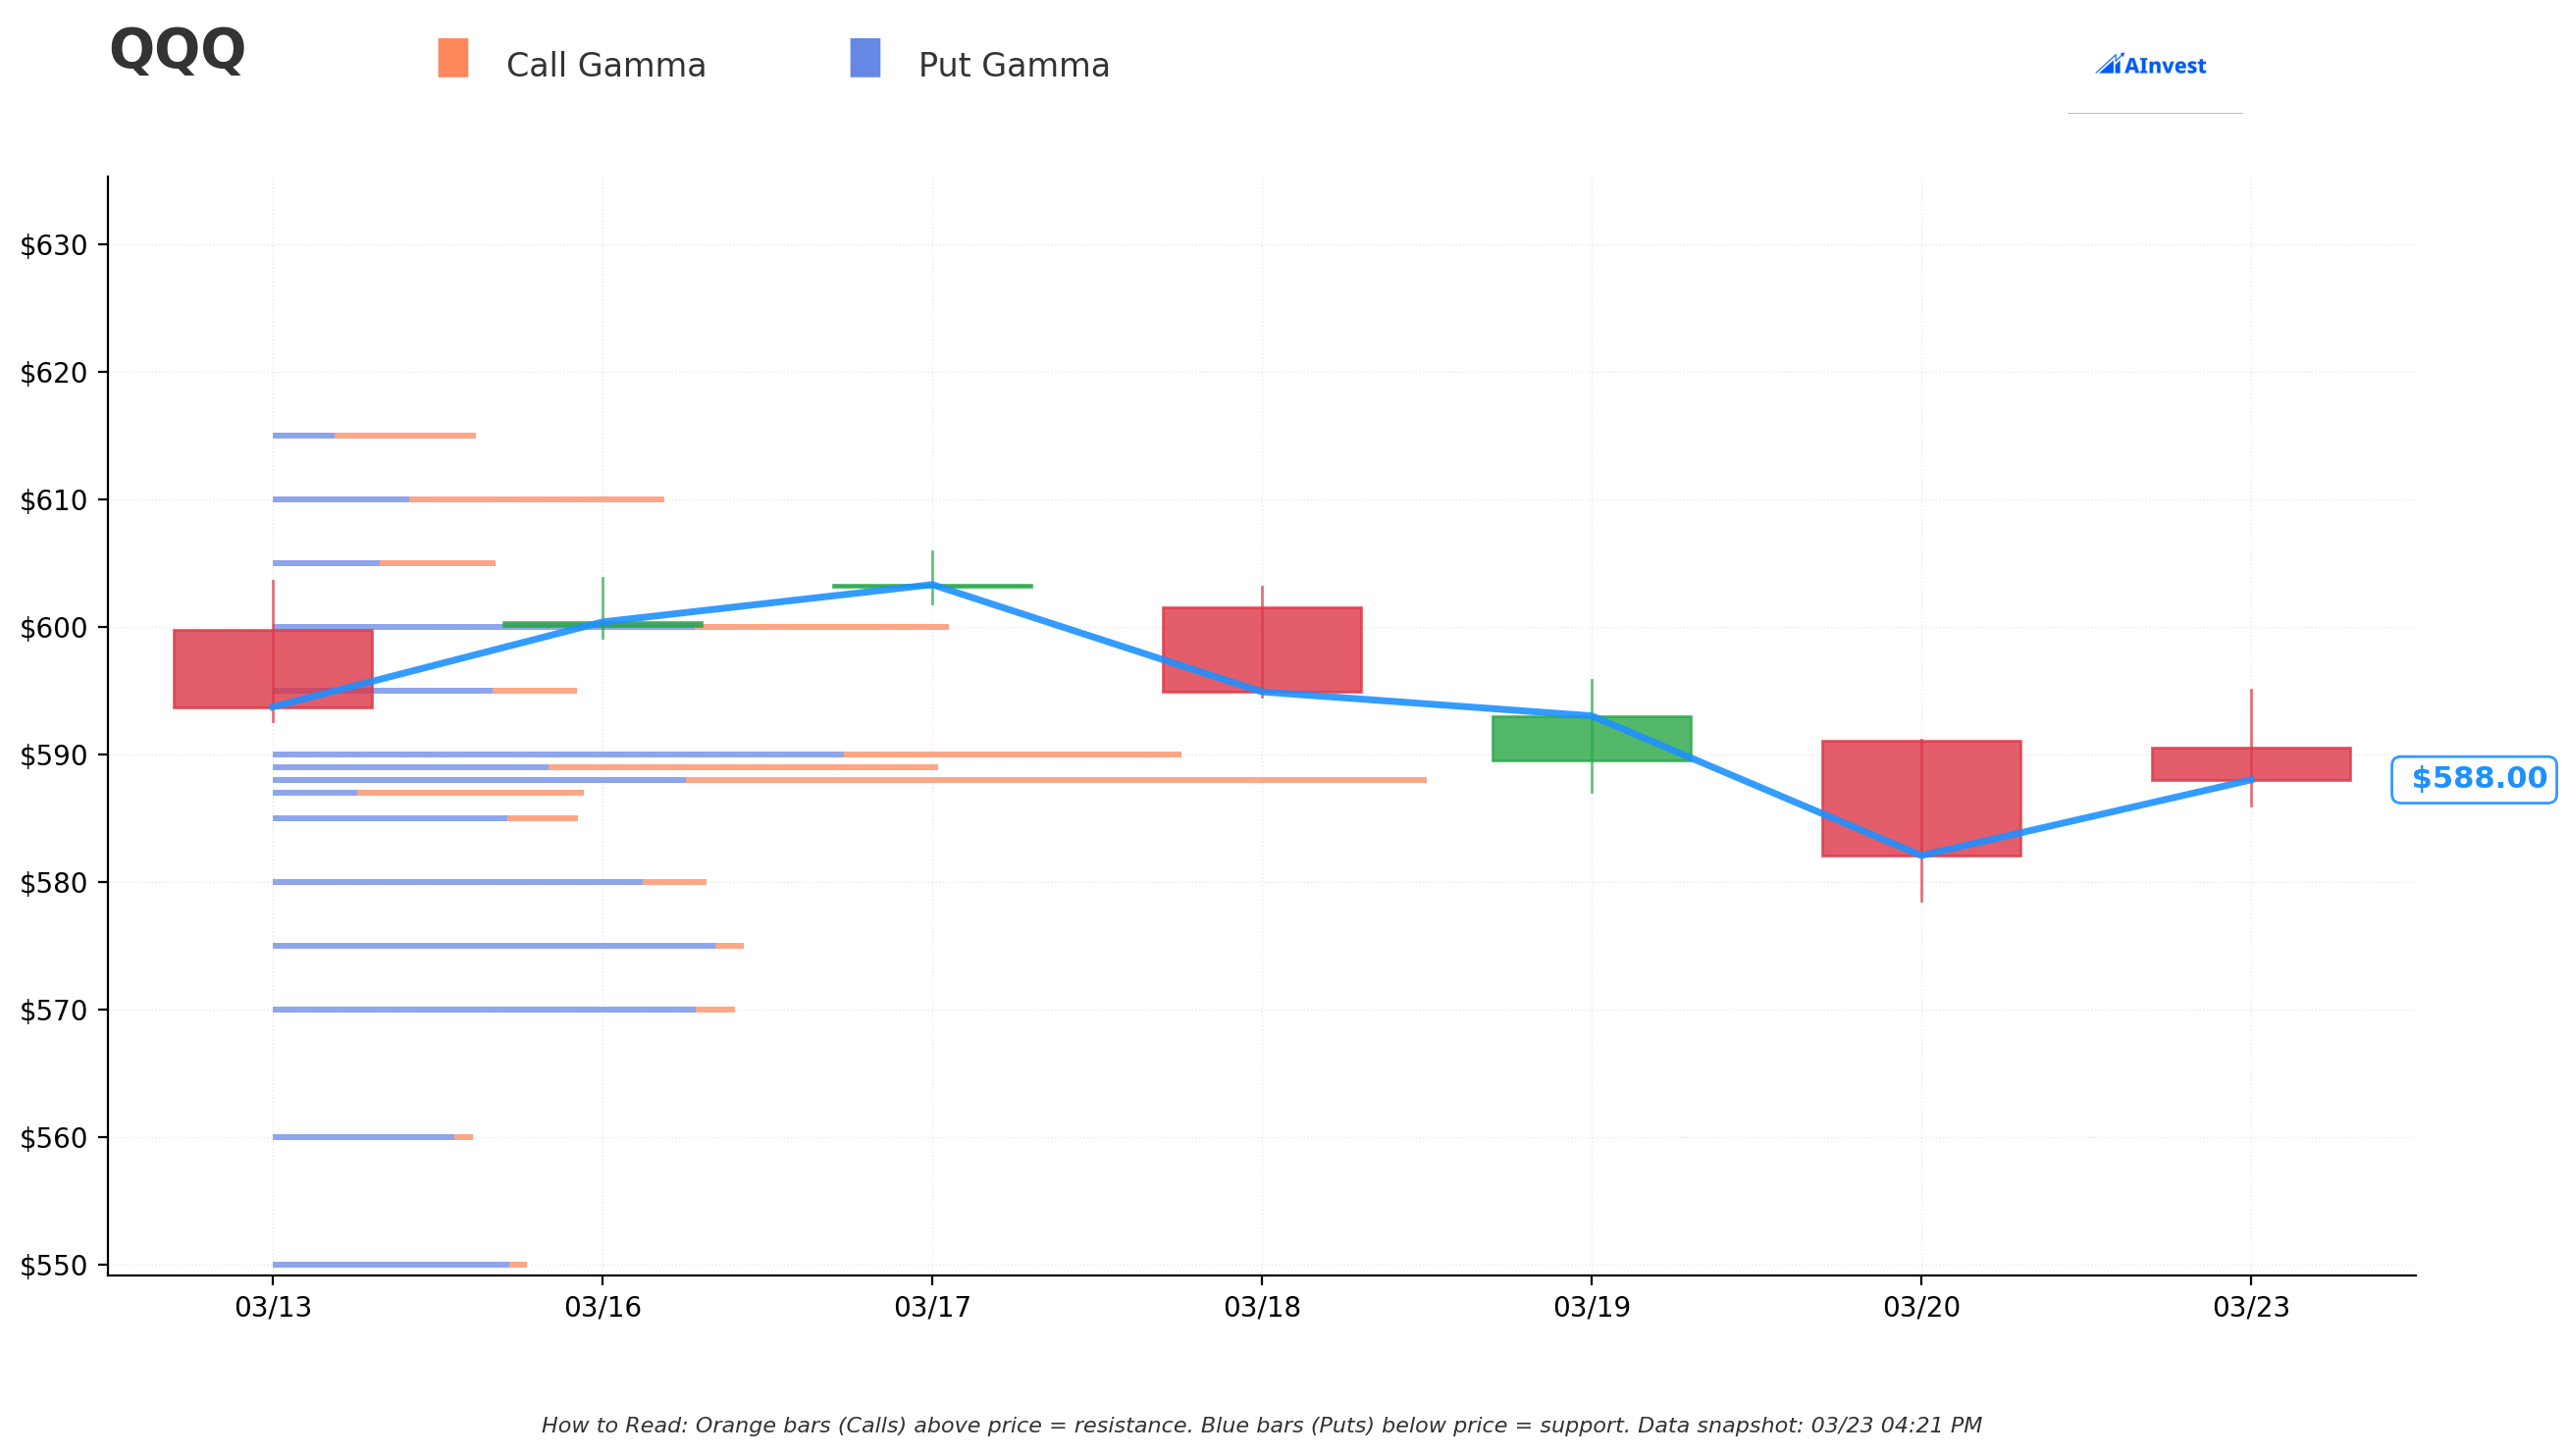
Current Price: $588.55
The gamma exposure map is telling a fascinating story right now. The data shows a tightly compressed battlefield - all the heavy action is clustered within 1% of the current price, with meaningful support and resistance stacked just below:
🔵 Support Levels (Put Gamma Below Price):
- $588 - Immediate support with 272.4B total gamma exposure (strongest nearby floor - dealers actively buying here)
- $587 - Secondary support at 74.7B gamma (0.26% below current price)
- $585 - Critical zone at 73.2B gamma with net negative GEX (-39.2B) - more put gamma than call gamma here, meaning market makers will buy dips aggressively to delta-hedge
- $580 - Significant structural floor at 103.9B gamma (1.45% below); put gamma dominates (88.7B vs 15.1B call gamma) - this is real support
- $575 - Expanded support at 112.8B gamma with 106.0B put gamma; this is the LINE IN THE SAND below which selling could accelerate
- $570 - Deep floor at 110.5B gamma (3.15% below current); 101.2B put gamma provides strong dealer buying
🟠 Resistance Levels (Call Gamma Above Price):
- $589 - Immediate ceiling at 164.8B total gamma (just 0.08% away - this is pinning QQQ right now!)
- $590 - Major resistance at 224.2B total gamma with interesting mix: 136.9B put gamma + 87.3B call gamma creates a gravitational zone
- $600 - Psychological and technical resistance at 162.7B total gamma (1.95% above current)
- $610 - Extended resistance at 94.4B gamma with 61.7B call gamma (3.6% above current)
Net GEX Bias: Bearish - Total put gamma (1,503.1B) significantly exceeds call gamma (1,131.5B). This means market makers are net long delta, which creates a stabilizing effect on the downside but also limits upside as dealers hedge by selling into rallies.
What this means for traders: QQQ is essentially pinned between $588 support and $589 resistance right now - an incredibly tight range driven by massive options positioning. The $590 level is a magnetic attractor with 224B in combined gamma. Below $585, net negative GEX flips market-maker dynamics: instead of stabilizing, they'll sell as price drops, which can accelerate moves lower. The $575-$580 zone represents major structural support that could stop any waterfall selling.
The put close makes gamma sense: With $589 as the pin and the put trader closing near-the-money puts at $584.78, they may believe $585-590 becomes the equilibrium zone heading into the next few weeks.
Implied Move Analysis
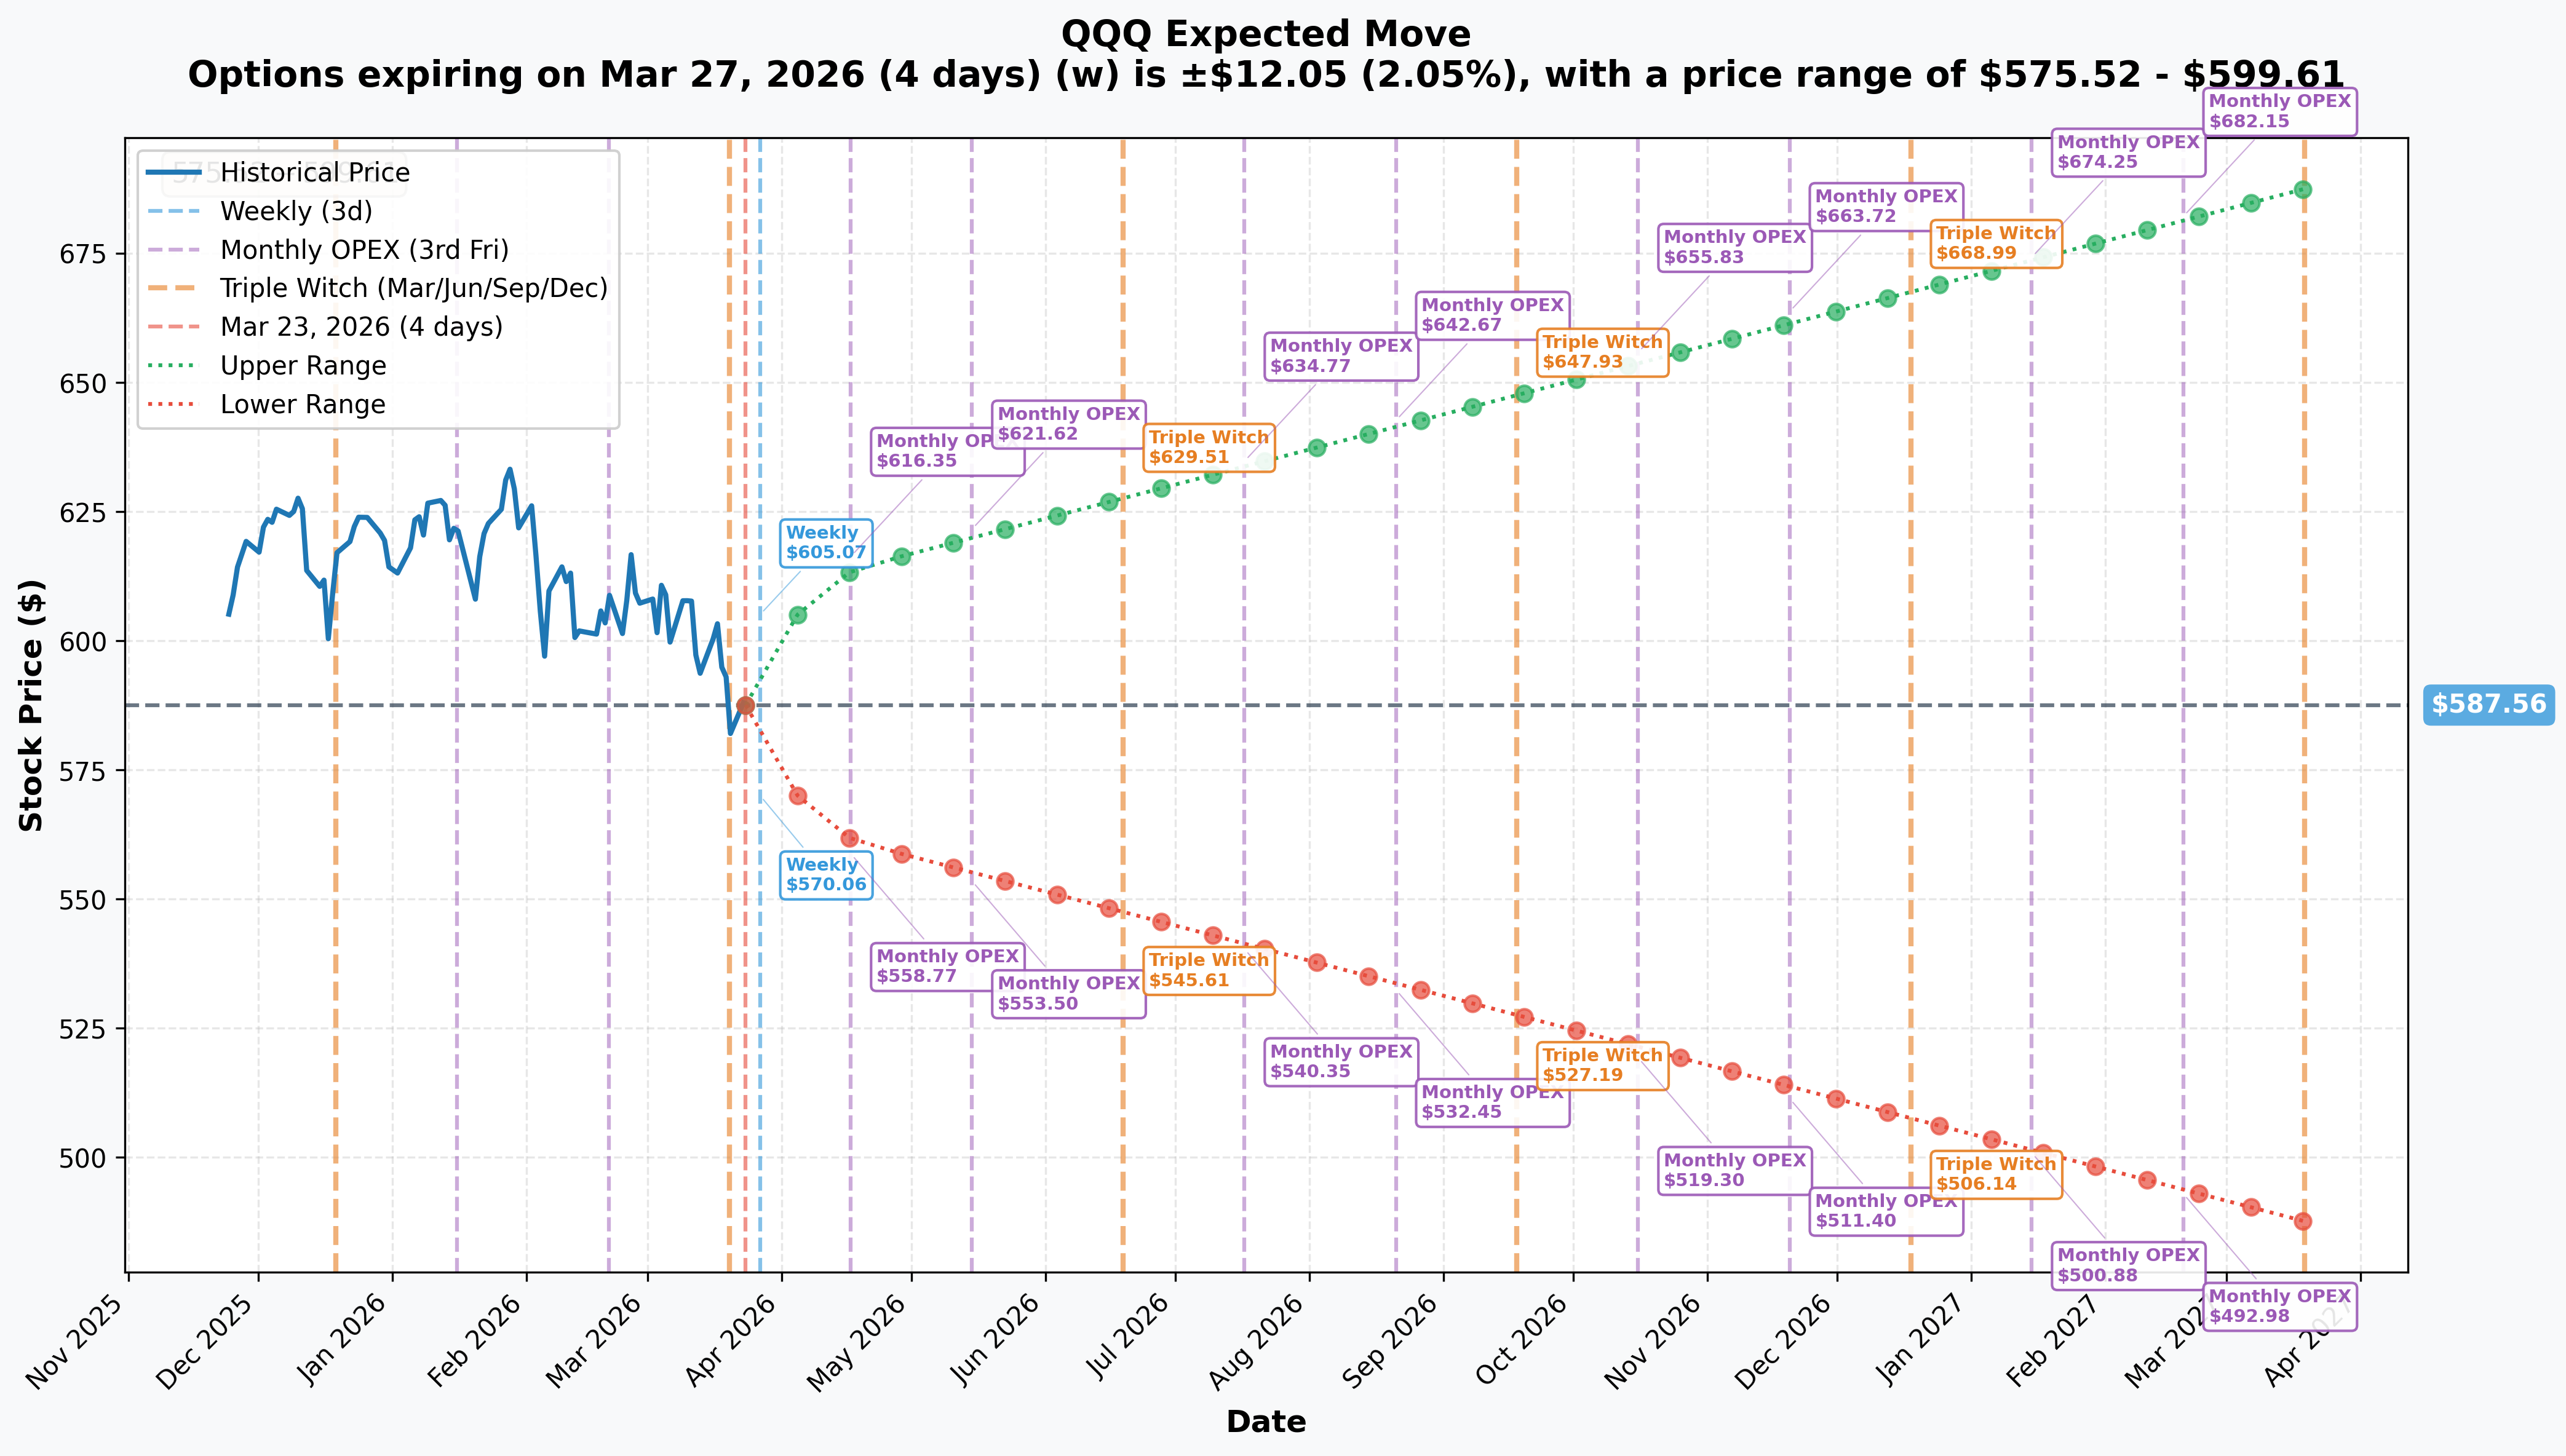
Options market pricing for upcoming expirations:
- 📅 Weekly (March 27 - 4 days): ±$12.05 (±2.05%) → Range: $575.52 - $599.61
- 📅 Monthly OPEX (April 17 - 25 days): ±$26.38 (±4.49%) → Range: $561.18 - $613.94
- 📅 June Triple Witch (June 19 - 87 days - THIS TRADE!): Range implied: $545.61 - $629.51
- 📅 LEAPS (March 2027 - 361 days): ±$100.07 (±17.03%) → Range: $487.50 - $687.63
Translation for regular folks: The market is pricing in a 2% move ($12) by Friday and a 4.5% swing ($26) through April OPEX. For the June 19th expiration (right next to where this put trade lives), the implied range stretches from $545.61 to $629.51 - that's an $84 range on a $587 ETF. Translation: the options market thinks there's a real scenario where QQQ is down another 7% OR up 7% from today by June expiry.
Key insight for the BTC trade: The put buyer is closing at $584.78 strike - right in the middle of the June implied range. If they were long these puts (hedge buyer), they're giving up downside protection that covers the lower half of the implied range ($545-$585). That's a deliberate, confident decision to remove protection at a specific level - suggesting the trader believes the $545-$580 scenario is less likely than the market is pricing in.
🎪 Catalysts
🔥 Recent Events (Already Happened - Context for Current Price Level)
Iran War Erupts - February 28, 2026 🛢️
The biggest macro shock of 2026 arrived when U.S. and Israeli forces launched military operations against Iran on February 28th. The consequences:
- 🛢️ Brent crude hit $113.71/barrel (March 19), currently $107.40 - a 25%+ surge
- 🚢 Strait of Hormuz partially disrupted: ~140 million barrels of oil shipments suspended
- 📉 Nasdaq lost 2.01% in the March 19-20 sessions alone
- ⛽ U.S. gas prices jumped ~$0.50/gallon in one week
This is the dominant macro risk overhanging QQQ right now. Every dollar oil moves higher is an inflation headwind that makes the Fed less likely to cut.
Fed Holds Rates at 3.50-3.75% - March 18, 2026 🏦
The FOMC voted 11-1 to hold rates and delivered a hawkish surprise:
- Dot plot signals only one rate cut in all of 2026 (down from earlier market expectations of 2-3 cuts)
- Raised PCE inflation projection to 2.7% - still above their 2% target
- GDP growth projection: 2.4% for 2026
- Higher-for-longer rates compress growth stock valuations most
Supreme Court IEEPA Ruling + Section 122 Tariff - February 2026 ⚖️
The Supreme Court struck down IEEPA tariff authority 6-3, invalidating the reciprocal tariffs from April 2025. Within hours, the administration imposed a 10% global tariff under Section 122, effective February 24, 2026. This 150-day tariff expires July 24, 2026 - right after the June puts this trade involves.
Nvidia GTC 2026 - March 16-20, 2026 🤖
CEO Jensen Huang projected $1 trillion in purchase orders for Blackwell and Vera Rubin through 2027. Unveiled Blackwell Ultra (GB300) with 20 petaFLOPS per DGX Station, and Vera Rubin Ultra for 2027. This was a bullish AI catalyst, but the stock and QQQ couldn't rally meaningfully with the Iran war backdrop.
Nvidia Q4 FY2026 Earnings Beat - February 25, 2026 💰
Nvidia posted $68.13B revenue vs $66.21B expected, up 73% YoY. Data center revenue: $62.3B - now 91% of total sales. Net income nearly doubled to $43B. Q1 FY2027 guidance of $78B. Despite this monster beat, QQQ has still pulled back - which tells you how heavy the macro headwinds are.
DeepSeek V4 Release - February 23, 2026 🤔
DeepSeek V4 reportedly outperforms ChatGPT and Claude on coding tasks. Renewed questions about whether $660-690B in U.S. AI capex is justified if Chinese labs can build competitive models cheaply. This efficiency question is the philosophical bearish case against the entire Nasdaq AI trade.
SMCI Scandal - March 19-20, 2026 ⚠️
Super Micro co-founder indicted for smuggling $2.5B in Nvidia AI chip servers to China. SMCI cratered 33% in 4 sessions. While SMCI is not in QQQ directly, the regulatory scrutiny narrative around AI chip distribution creates headline risk for the entire AI supply chain.
🚀 Upcoming Catalysts (Next 6 Months - Key for June Put Trade)
Mag 7 Earnings Season - Late April to May 2026 📊
This is THE catalyst cluster that will determine whether the June puts expire worthless or pay off:
| Company | Expected Date | What to Watch |
|---|---|---|
| Alphabet (GOOGL) | ~April 23, 2026 | Cloud/AI capex guidance |
| Microsoft (MSFT) | April 28, 2026 (confirmed) | Azure growth rate (39% last Q) |
| Meta (META) | ~April 29, 2026 | $115-135B capex commitment intact? |
| Amazon (AMZN) | ~April 29, 2026 | AWS growth + $200B capex spend |
| Apple (AAPL) | ~April 30, 2026 | Consumer demand + AI Siri progress |
| Nvidia (NVDA) | ~May 20, 2026 | Blackwell ramp + Q2 guidance |
If these companies collectively report strong results AND maintain their AI capex commitments, QQQ could reclaim $600-615 by mid-May. Any capex guidance pullback would be severely bearish.
Apple WWDC 2026 - June 8-12, 2026 🍎
Apple just announced WWDC 2026 today with keynote June 8 at 10am PT, explicitly teasing "AI advancements." Expected to unveil:
- Gemini-powered Siri chatbot ("Project Campos") backed by $1B/year Google deal
- New "Core AI" framework to replace Core ML
- iOS 27 and cross-platform AI features
This lands 10 days before the June 18th put expiration in this trade. A strong WWDC showing for Apple (7.34% of QQQ) is a direct bullish catalyst for these puts to expire worthless.
Section 122 Tariff Expiration - July 24, 2026 ⚖️
The 10% global tariff expires after 150 days. This is a binary catalyst for QQQ - either it expires (bullish relief), or new Section 301 tariffs replace it (potentially worse). The put expiration on June 18th comes 36 days before this resolution, meaning option holders are exposed to tariff uncertainty but won't see the actual resolution.
Fed Rate Decisions - May 6, June 17, July 29 🏦
The June 17th FOMC meeting is one day before this put trade expires. Any dovish pivot or signal of rate cuts would be a major QQQ catalyst. Given the Iran war's inflation impact, the base case is "hold" - but de-escalation could change everything.
Nasdaq-100 Special Rebalance Risk - Potential July 2026 📊
If NVDA appreciation pushes concentration above thresholds, a special rebalance could trigger forced selling. The most recent special rebalance was July 2025, capping AAPL and MSFT. NVDA at 8.66% is below the 24% single-name cap for now.
🎲 Price Targets & Probabilities
Using gamma levels, implied move data, and catalyst analysis:
🐂 Bull Case: $610-$615 by June 18th (35% probability)
What needs to happen:
- Mag 7 earnings season (April-May) delivers beats with maintained AI capex guidance
- Iran war shows signs of de-escalation, oil drops back toward $85-90
- Fed signals potential June/July rate cut as inflation pressures ease
- Apple WWDC on June 8 impresses with AI Siri reveal
Gamma perspective: Breaking above $600 resistance (162.7B gamma) would unlock a move toward $610 where 94.4B call gamma provides the next ceiling. Gamma implications suggest $589-$600 is the more likely near-term range until a macro catalyst breaks the stalemate.
Implied move says: The June 19th implied upper range is $629.51 - the market IS pricing a path to $615+ (one standard deviation upside). This is the scenario where the $585 put closes worthless, and whoever held this short put position as an income play wins.
⚖️ Base Case: $575-$595 by June 18th (45% probability)
The muddle-through scenario:
- Earnings season is mixed (some beats, some misses on guidance)
- Oil stays elevated at $95-110, limiting Fed flexibility
- Tariff uncertainty persists until July, capping upside
- QQQ stays range-bound between $575 gamma support and $600 resistance
Gamma perspective: The massive put gamma stacked at $575 (112.8B) and $580 (103.9B) provides a sticky floor. Meanwhile $589-$590 resistance (389B combined gamma) creates a ceiling. This range-bound scenario is actually the highest probability outcome given the current gamma structure.
What it means for the BTC trader: If someone was short these puts at a higher premium (maybe $25-30 when QQQ was at $610-620), closing at $21.20 in the base case is a profitable trade even if expiration is still uncertain.
🐻 Bear Case: $545-$565 by June 18th (20% probability)
What needs to happen for the puts to go deep in-the-money:
- Iran war escalates significantly (Hormuz fully closed, oil spikes to $130+)
- Major Mag 7 earnings misses OR capex guidance cuts (particularly Microsoft Azure growth below 30%)
- Fed forced to consider rate hikes due to persistent inflation
- DeepSeek or similar efficiency shock prompts genuine AI capex rethink
Gamma perspective: Below $575, put gamma dominance accelerates. The net negative GEX at $585 and below means market-maker delta hedging would actually amplify selling pressure - the opposite of the stabilizing effect above $588. A flush to $545-$560 would bring QQQ back toward its 52-week low range.
Implied move says: June implied lower range of $545.61 is right in this territory. These scenarios are priced - just not the highest probability.
💡 Trading Ideas
🛡️ Conservative - "Wait and See" Approach
Strategy: Cash-Secured Put at $570 (June 19th expiry)
If you believe QQQ stays above $570 through June OPEX and want to collect premium in a volatile environment:
- Sell 1 QQQ June 19 $570 Put
- Collect approximately $8-10 premium (based on current implied vol)
- Requires $57,000 in cash as collateral per contract
- Max profit: ~$900 per contract if QQQ stays above $570
- Breakeven: ~$560
Why this works: The $570-$575 zone has 185B+ in combined put gamma - market makers have massive reasons to support price here. You're selling protection at a level where the gamma structure agrees with you. If QQQ ends above $570 by June 19th, you pocket the premium.
Risk: If Iran escalates badly or Mag 7 earnings are a disaster, QQQ could breach $570. Set a mental stop if QQQ trades below $575 for more than 2 consecutive sessions.
Probability of profit: ~70% based on current delta positioning.
⚖️ Balanced - "Defined Risk, Defined Reward"
Strategy: Bull Put Spread ($575/$560 - June 19th expiry)
For traders who think the $575 floor holds but want defined risk:
- Sell 1 QQQ June 19 $575 Put, Buy 1 QQQ June 19 $560 Put
- Net credit: ~$4-5 per spread
- Max profit: $400-500 per spread (QQQ stays above $575)
- Max loss: ~$1,000-1,100 per spread (QQQ closes at or below $560)
- Breakeven: ~$570-$571
Why this works: You're collecting premium on a scenario you believe won't happen (QQQ below $575), while capping your maximum loss. The spread lets you participate in the "gamma floor at $575" thesis without risking unlimited losses if you're wrong. The risk/reward is roughly 1:2 (risk $1,000 to make $450), which is acceptable given ~65-70% probability of full profit.
Key catalyst watch: April 28-30 Mag 7 earnings week is the binary event for this trade. A strong showing from MSFT/META/AMZN/AAPL all in the same week is the primary driver toward max profit.
🚀 Aggressive - "Follow the Institutional Unwind"
Strategy: QQQ Synthetic Recovery - Debit Call Spread
If you believe the BTC trade signals that smart money is repositioning for a recovery:
- Buy 1 QQQ April 17 $590 Call, Sell 1 QQQ April 17 $610 Call
- Debit: ~$6-7 per spread
- Max profit: ~$1,300-1,400 per spread (QQQ above $610 by April 17)
- Max loss: $600-700 per spread (QQQ below $590 at expiry)
- Breakeven: ~$596-597
Why this works: You're playing the near-term bounce thesis into Mag 7 earnings season. The $600 gamma resistance is real, but earnings beats from Apple, Microsoft, and Meta could push QQQ toward $610+. You're risking limited capital for 2x potential return in 25 days.
The institutional signal: When someone closes $11M in put protection, they're implicitly signaling they believe downside risk is diminishing. Following the smart money directionally - while limiting your own risk with a defined debit spread - gives you exposure to the thesis without the concentration risk.
Key risk: If Mag 7 earnings disappoint or Iran escalates before April 17th, your $600-700 loss per spread is the maximum damage. Size accordingly - this is a higher-risk position.
⚠️ Risk Factors
1. Iran War Escalation 🛢️ This is the fat-tail risk that breaks every bullish analysis. If the Strait of Hormuz is fully blocked, oil to $130+ is realistic. That forces the Fed into a hawkish hold indefinitely and creates genuine stagflation pressure. QQQ would almost certainly see $545-$560 in that scenario. No gamma level or earnings beat offsets a $130 oil environment.
2. Mag 7 Capex Guidance Cuts ❗ Five hyperscalers committed $660-690B in 2026 AI capex. If ANY of the major names (particularly Amazon $200B or Meta $115-135B) trim guidance in April/May earnings, the AI narrative cracks. Every capex dollar cut is a direct revenue headwind for Nvidia, which is 8.66% of QQQ.
3. DeepSeek Efficiency Disruption 🤔 DeepSeek V4 suggested efficient AI is possible without massive hardware. If this narrative accelerates and major tech companies acknowledge reduced hardware needs, the entire AI capex cycle - which is the primary bull thesis for QQQ - gets called into question.
4. Federal Reserve Surprise ⚠️ The base case is one cut in 2026. But if oil-driven inflation is stickier than expected, the Fed could eliminate even that projected cut. A "no cuts ever" scenario or, worse, a discussion of rate hikes would hit QQQ hard given high valuations on growth names.
5. QQQ Fund Flow Reversal 📉 $7 billion net outflow in February was historic. If institutional rotation away from mega-cap tech into value/dividend names accelerates, the selling pressure is structural, not just event-driven. This could cap any rally even on good earnings.
6. Tariff Escalation Beyond Section 122 🌐 The 150-day Section 122 tariff expires July 24. But the administration is preparing Section 301 country-specific tariffs during this window. If the replacement regime is more aggressive (15%+ on China specifically), tech supply chains get disrupted and margin compression follows.
7. SMCI Contagion Risk ❗ The SMCI smuggling indictment raised DOJ/Commerce scrutiny of the entire AI chip distribution chain. If investigations expand to other hardware vendors or distributors, regulatory overhang could weigh on semiconductor-exposed names in QQQ.
🎯 The Bottom Line
Real talk: This $11M BTC trade is institutional money making a tactical decision - either locking in profits on short put positions that were placed when QQQ was at higher levels, or deliberately removing downside hedges because they believe the worst of the macro storm is passing.
Here's the deal for traders:
🟢 If you're already long QQQ: The put unwind is modestly constructive signal - someone with significant exposure decided protection at $585 wasn't worth the premium anymore. Hold your position, but know the key levels: $575-580 gamma floor is YOUR risk level. If QQQ breaks and holds below $575, the gamma structure turns against bulls and selling can accelerate.
👀 If you're watching from the sidelines: The most intelligent entry signal isn't today's BTC trade - it's the upcoming Mag 7 earnings season. Mark your calendar for April 28-30 (MSFT, META, AMZN, AAPL in a 3-day window). If that week delivers strong results with maintained AI capex guidance, QQQ breaks through $600 resistance and the path to $615-625 opens. That's the better entry signal than chasing a BTC unwind.
😰 If you're bearish: The Iran war trajectory is your thesis vehicle, not Mag 7 fundamentals. The QQQ at $587 is already pricing in significant stress. For a deeper bearish play, you'd need oil to sustain above $110 AND at least one major Mag 7 earnings miss. The gamma data shows $575-580 as strong structural support - breaking through there is a significant event that requires multiple catalysts aligning.
Timing reminder:
- 📅 April 17 - April Monthly OPEX; good checkpoint for positioning
- 📅 April 28-30 - Mag 7 earnings cluster (THE critical event)
- 📅 May 20 - Nvidia earnings (AI demand confirmation or denial)
- 📅 June 8-12 - Apple WWDC (10 days before put expiry)
- 📅 June 17 - FOMC meeting (1 day before put expiry!)
- 📅 June 18 - QQQ put expiration (this trade's deadline)
- 📅 July 24 - Section 122 tariff expiration
The bottom line on the broader environment: QQQ at $587 reflects a market caught between world-class AI fundamentals ($660-690B capex commitments, Nvidia's $1T order pipeline, Mag 7 profitability) and genuine macro headwinds (oil war, rate hold, tariff regime uncertainty). The smart institutional move - like this $11M put close - is to manage risk tactically while the macro picture develops, rather than making big directional bets on a single scenario.
⚠️ Disclaimer: This analysis is for informational and educational purposes only. Options trading involves substantial risk and is not suitable for all investors. The analysis of unusual options activity does not constitute a recommendation to buy or sell any security. Past unusual activity is not a guarantee of future price movements. All options strategies discussed carry risk of total loss of premium paid. Please consult a qualified financial advisor before making investment decisions. All data sourced from publicly available market data as of March 23, 2026.
Published by OptionLabs | March 23, 2026